

67
the cost calculations of the future products in 1991, and values after 2010 were calculated by the Low Carbon Society Strategy Center. From 2010 onwards, due to
market expansion and intensified competition, the module price sharply declined
and it is now approaching the cost calculation value. In particular, despite the effects
of foreign exchange and national policy, the selling price of the modules made in
China is lower than the cost. Following the U.S., an anti-dumping and antisubsidization tax was imposed in Europe in 2012 on solar panels made in China, but
it seems there is a logical basis for this based on our cost calculation.
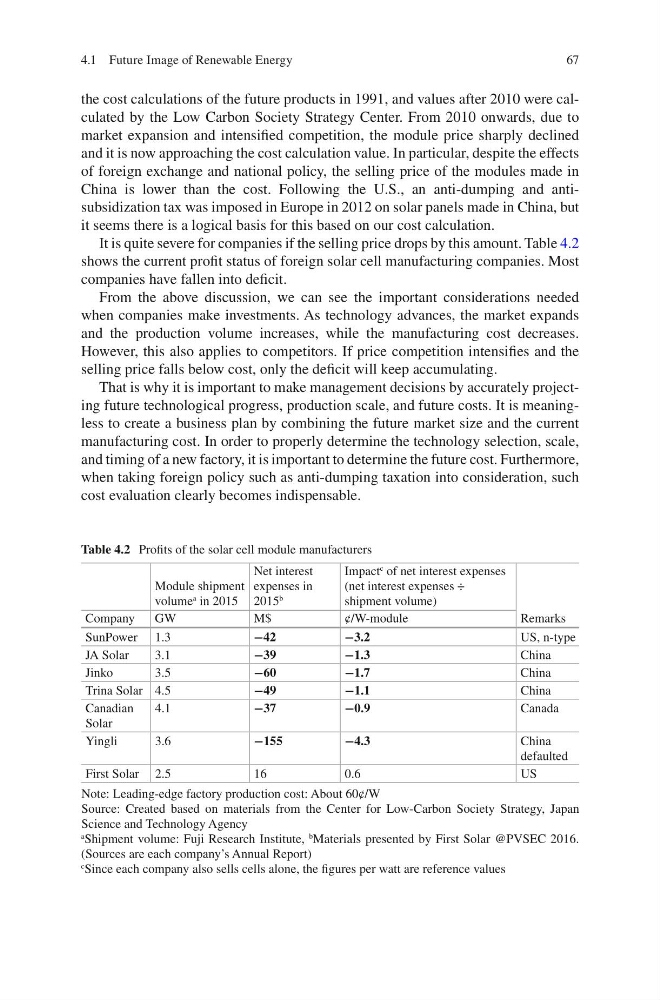
It is quite severe for companies if the selling price drops by this amount. Table 4.2
shows the current profit status of foreign solar cell manufacturing companies. Most
companies have fallen into deficit.
From the above discussion, we can see the important considerations needed
when companies make investments. As technology advances, the market expands
and the production volume increases, while the manufacturing cost decreases.
However, this also applies to competitors. If price competition intensifies and the
selling price falls below cost, only the deficit will keep accumulating.
That is why it is important to make management decisions by accurately projecting future technological progress, production scale, and future costs. It is meaningless to create a business plan by combining the future market size and the current
manufacturing cost. In order to properly determine the technology selection, scale,
and timing of a new factory, it is important to determine the future cost. Furthermore,
when taking foreign policy such as anti-dumping taxation into consideration, such
cost evaluation clearly becomes indispensable.
Table 4.2 Profits of the solar cell module manufacturers
Module shipment
volume
a in 2015
Net interest
expenses in
2015
b
Impact
c of net interest expenses
(net interest expenses ÷
shipment volume)
Remarks
Company
GW
M$
¢/W-module
SunPower 1.3
−42
−3.2
US, n-type
JA Solar
3.1
−39
−1.3
China
Jinko
3.5
−60
−1.7
China
Trina Solar 4.5
−49
−1.1
China
Canadian
Solar
4.1
−37
−0.9
Canada
Yingli
3.6
−155
−4.3
China
defaulted
First Solar 2.5
16
0.6
US
Note: Leading-edge factory production cost: About 60¢/W
Source: Created based on materials from the Center for Low-Carbon Society Strategy, Japan
Science and Technology Agency
a Shipment volume: Fuji Research Institute,
b Materials presented by First Solar @PVSEC 2016.
(Sources are each company’s Annual Report)
c Since each company also sells cells alone, the figures per watt are reference values
4.1 Future Image of Renewable Energy
the cost calculations of the future products in 1991, and values after 2010 were calculated by the Low Carbon Society Strategy Center. From 2010 onwards, due to
market expansion and intensified competition, the module price sharply declined
and it is now approaching the cost calculation value. In particular, despite the effects
of foreign exchange and national policy, the selling price of the modules made in
China is lower than the cost. Following the U.S., an anti-dumping and antisubsidization tax was imposed in Europe in 2012 on solar panels made in China, but
it seems there is a logical basis for this based on our cost calculation.
It is quite severe for companies if the selling price drops by this amount. Table 4.2
shows the current profit status of foreign solar cell manufacturing companies. Most
companies have fallen into deficit.
From the above discussion, we can see the important considerations needed
when companies make investments. As technology advances, the market expands
and the production volume increases, while the manufacturing cost decreases.
However, this also applies to competitors. If price competition intensifies and the
selling price falls below cost, only the deficit will keep accumulating.
That is why it is important to make management decisions by accurately projecting future technological progress, production scale, and future costs. It is meaningless to create a business plan by combining the future market size and the current
manufacturing cost. In order to properly determine the technology selection, scale,
and timing of a new factory, it is important to determine the future cost. Furthermore,
when taking foreign policy such as anti-dumping taxation into consideration, such
cost evaluation clearly becomes indispensable.
Table 4.2 Profits of the solar cell module manufacturers
Module shipment
volume
a in 2015
Net interest
expenses in
2015
b
Impact
c of net interest expenses
(net interest expenses ÷
shipment volume)
Remarks
Company
GW
M$
¢/W-module
SunPower 1.3
−42
−3.2
US, n-type
JA Solar
3.1
−39
−1.3
China
Jinko
3.5
−60
−1.7
China
Trina Solar 4.5
−49
−1.1
China
Canadian
Solar
4.1
−37
−0.9
Canada
Yingli
3.6
−155
−4.3
China
defaulted
First Solar 2.5
16
0.6
US
Note: Leading-edge factory production cost: About 60¢/W
Source: Created based on materials from the Center for Low-Carbon Society Strategy, Japan
Science and Technology Agency
a Shipment volume: Fuji Research Institute,
b Materials presented by First Solar @PVSEC 2016.
(Sources are each company’s Annual Report)
c Since each company also sells cells alone, the figures per watt are reference values
4.1 Future Image of Renewable Energy