

38
4.4 Application to the City of Amsterdam
By way of example, the proposed approach was applied to the city of Amsterdam.
A 10 × 10-km study area was selected to analyse the existing UGIs and to assess
their cooling capacity. Amsterdam belongs to the cold temperate moist zone, corresponding to the Atlantic climatic region. Tree canopy coverage, soil cover and
UGI size were mapped using available data (Fig. 4.4).
Overall, 74,653 patches, covering 8477 hectares, were mapped. The mapped
UGI consist almost entirely (90%) of water and of green areas with a tree canopy
coverage below 20%. A heterogeneous soil cover with tree canopy coverage below
20%, sealed patches with tree canopy coverage below the 20%, sealed patches with
tree canopy coverage between 20 and 40%, and grass soil cover with tree canopy
coverage below 20% characterize the remaining 10% of the mapped UGI.
Accordingly, Fig. 4.5 presents the results of the cooling capacity assessment with
scores from 0 to 100. Most UGI have a low cooling capacity: 34% of total UGI
score less than 25, 13% score between 25 and 30, 22% score between 30 and 60, and
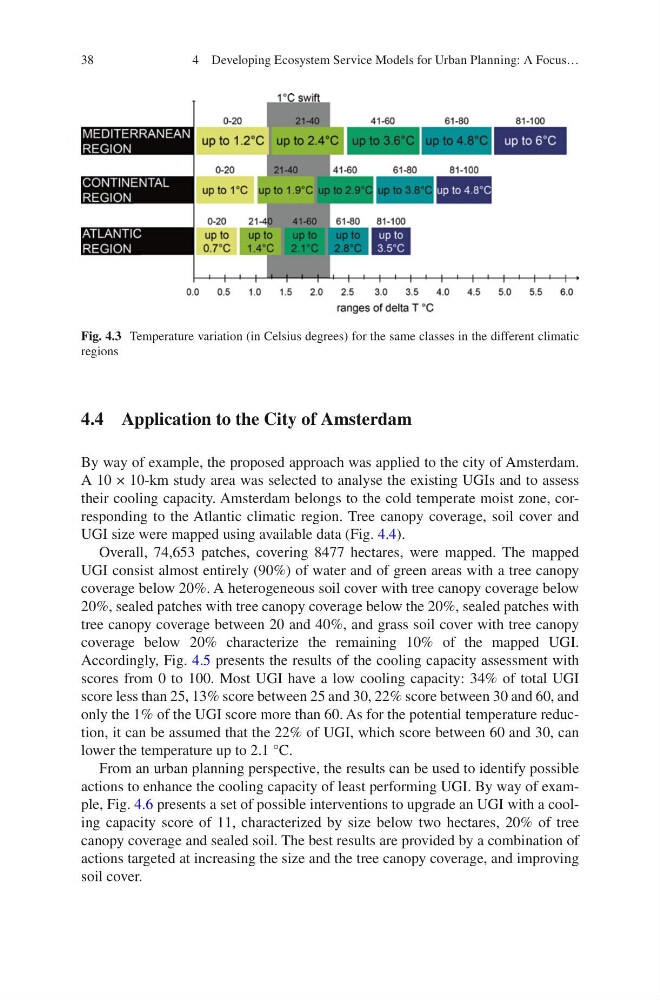
only the 1% of the UGI score more than 60. As for the potential temperature reduction, it can be assumed that the 22% of UGI, which score between 60 and 30, can
lower the temperature up to 2.1 °C.
From an urban planning perspective, the results can be used to identify possible
actions to enhance the cooling capacity of least performing UGI. By way of example, Fig. 4.6 presents a set of possible interventions to upgrade an UGI with a cooling capacity score of 11, characterized by size below two hectares, 20% of tree
canopy coverage and sealed soil. The best results are provided by a combination of
actions targeted at increasing the size and the tree canopy coverage, and improving
soil cover.
Fig. 4.3 Temperature variation (in Celsius degrees) for the same classes in the different climatic
regions
4 Developing Ecosystem Service Models for Urban Planning: A Focus…
4.4 Application to the City of Amsterdam
By way of example, the proposed approach was applied to the city of Amsterdam.
A 10 × 10-km study area was selected to analyse the existing UGIs and to assess
their cooling capacity. Amsterdam belongs to the cold temperate moist zone, corresponding to the Atlantic climatic region. Tree canopy coverage, soil cover and
UGI size were mapped using available data (Fig. 4.4).
Overall, 74,653 patches, covering 8477 hectares, were mapped. The mapped
UGI consist almost entirely (90%) of water and of green areas with a tree canopy
coverage below 20%. A heterogeneous soil cover with tree canopy coverage below
20%, sealed patches with tree canopy coverage below the 20%, sealed patches with
tree canopy coverage between 20 and 40%, and grass soil cover with tree canopy
coverage below 20% characterize the remaining 10% of the mapped UGI.
Accordingly, Fig. 4.5 presents the results of the cooling capacity assessment with
scores from 0 to 100. Most UGI have a low cooling capacity: 34% of total UGI
score less than 25, 13% score between 25 and 30, 22% score between 30 and 60, and
only the 1% of the UGI score more than 60. As for the potential temperature reduction, it can be assumed that the 22% of UGI, which score between 60 and 30, can
lower the temperature up to 2.1 °C.
From an urban planning perspective, the results can be used to identify possible
actions to enhance the cooling capacity of least performing UGI. By way of example, Fig. 4.6 presents a set of possible interventions to upgrade an UGI with a cooling capacity score of 11, characterized by size below two hectares, 20% of tree
canopy coverage and sealed soil. The best results are provided by a combination of
actions targeted at increasing the size and the tree canopy coverage, and improving
soil cover.
Fig. 4.3 Temperature variation (in Celsius degrees) for the same classes in the different climatic
regions
4 Developing Ecosystem Service Models for Urban Planning: A Focus…