

36
into changes in air temperature is significantly affected by the climatic region: UGI
can lower daily maximum near-surface temperature especially in hot and dry conditions (Taha et al. 1991).
4.3 Assessing the Cooling Capacity of UGI Typologies
Figure 4.2 summarizes the assessment of the cooling capacity of 50 different typologies of UGI, for the three climatic regions. From the analysis of the table it is possible to note that 26% of the UGI typologies have the highest scores (from 81 to
100), 17% of UGI typologies score between 61 and 80, 23% from 41 to 60, 23%
from 21 to 40, and 12% score from 0 to 20. Indeed, size is the most influent component among the three; for example, all UGI scoring more than 60 have a size above
the two hectares, while only 3% of the UGI that are above the two hectares score
less than 60 below. Furthermore, no UGI with size smaller than two hectares scores
more than 60. While scores between 41 and 60 comprise mainly areas smaller than
two hectares (91%). This includes all the UGI with 100% of tree canopy coverage,
and most of UGI with 80% of tree canopy coverage. The UGI scoring between 21
and 40 are smaller than two hectares and have tree canopy coverage between 20 and
60%. Thus, the second most influential component, after the size, is the tree canopy
coverage, followed by soil cover.
In terms of the expected temperature changes, according to the climatic region,
each score implies a different temperature decrease. As shown in Fig. 4.3, the
Mediterranean region is where larger changes occur, followed by the Continental
area and the Atlantic region. For example, an UGI with a cooling capacity score of
100, in the Atlantic region, can decrease the temperature up to 3.5 °C, while the
same UGI, in the Mediterranean region, can reduce the temperature of up to
6 °C. Therefore, investing on UGI to improve their cooling capacity has different
implications in terms of temperature decrease, depending on the climatic region
(e.g., see grey rectangle in Fig. 4.3).
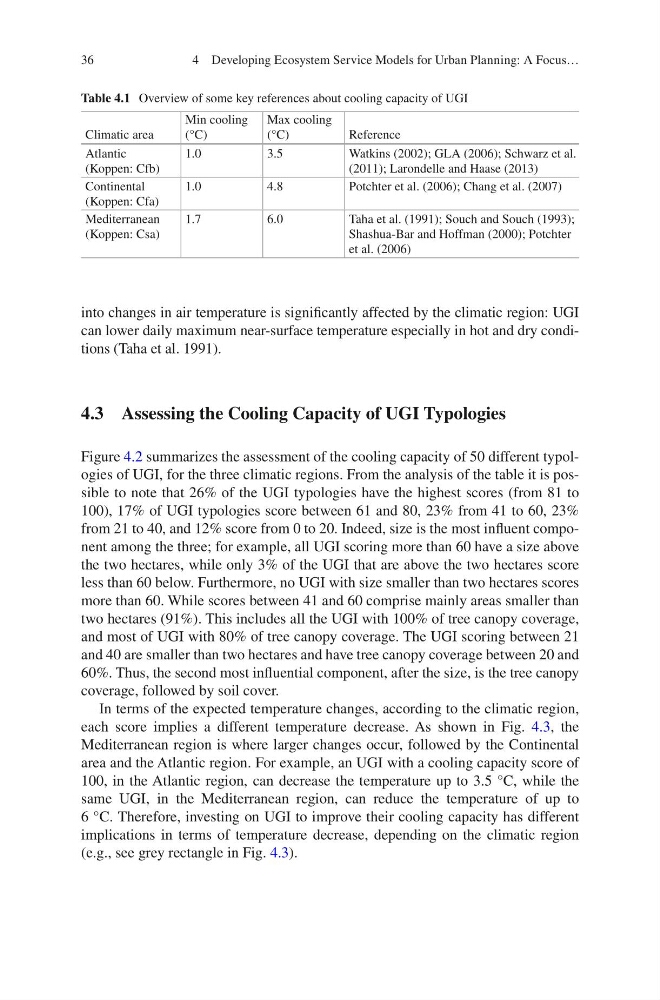
Table 4.1 Overview of some key references about cooling capacity of UGI
Climatic area
Min cooling
(°C)
Max cooling
(°C)
Reference
Atlantic
(Koppen: Cfb)
1.0
3.5
Watkins (2002); GLA (2006); Schwarz et al.
(2011); Larondelle and Haase (2013)
Continental
(Koppen: Cfa)
1.0
4.8
Potchter et al. (2006); Chang et al. (2007)
Mediterranean
(Koppen: Csa)
1.7
6.0
Taha et al. (1991); Souch and Souch (1993);
Shashua-Bar and Hoffman (2000); Potchter
et al. (2006)
4 Developing Ecosystem Service Models for Urban Planning: A Focus…
into changes in air temperature is significantly affected by the climatic region: UGI
can lower daily maximum near-surface temperature especially in hot and dry conditions (Taha et al. 1991).
4.3 Assessing the Cooling Capacity of UGI Typologies
Figure 4.2 summarizes the assessment of the cooling capacity of 50 different typologies of UGI, for the three climatic regions. From the analysis of the table it is possible to note that 26% of the UGI typologies have the highest scores (from 81 to
100), 17% of UGI typologies score between 61 and 80, 23% from 41 to 60, 23%
from 21 to 40, and 12% score from 0 to 20. Indeed, size is the most influent component among the three; for example, all UGI scoring more than 60 have a size above
the two hectares, while only 3% of the UGI that are above the two hectares score
less than 60 below. Furthermore, no UGI with size smaller than two hectares scores
more than 60. While scores between 41 and 60 comprise mainly areas smaller than
two hectares (91%). This includes all the UGI with 100% of tree canopy coverage,
and most of UGI with 80% of tree canopy coverage. The UGI scoring between 21
and 40 are smaller than two hectares and have tree canopy coverage between 20 and
60%. Thus, the second most influential component, after the size, is the tree canopy
coverage, followed by soil cover.
In terms of the expected temperature changes, according to the climatic region,
each score implies a different temperature decrease. As shown in Fig. 4.3, the
Mediterranean region is where larger changes occur, followed by the Continental
area and the Atlantic region. For example, an UGI with a cooling capacity score of
100, in the Atlantic region, can decrease the temperature up to 3.5 °C, while the
same UGI, in the Mediterranean region, can reduce the temperature of up to
6 °C. Therefore, investing on UGI to improve their cooling capacity has different
implications in terms of temperature decrease, depending on the climatic region
(e.g., see grey rectangle in Fig. 4.3).
Table 4.1 Overview of some key references about cooling capacity of UGI
Climatic area
Min cooling
(°C)
Max cooling
(°C)
Reference
Atlantic
(Koppen: Cfb)
1.0
3.5
Watkins (2002); GLA (2006); Schwarz et al.
(2011); Larondelle and Haase (2013)
Continental
(Koppen: Cfa)
1.0
4.8
Potchter et al. (2006); Chang et al. (2007)
Mediterranean
(Koppen: Csa)
1.7
6.0
Taha et al. (1991); Souch and Souch (1993);
Shashua-Bar and Hoffman (2000); Potchter
et al. (2006)
4 Developing Ecosystem Service Models for Urban Planning: A Focus…