

33
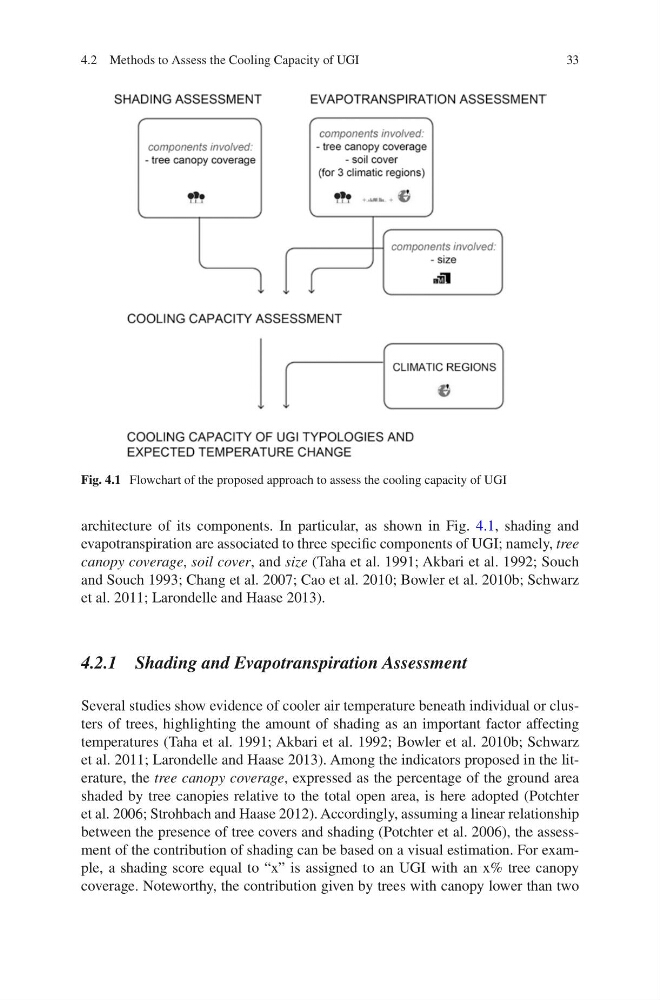
architecture of its components. In particular, as shown in Fig. 4.1, shading and
evapotranspiration are associated to three specific components of UGI; namely, tree
canopy coverage, soil cover, and size (Taha et al. 1991; Akbari et al. 1992; Souch
and Souch 1993; Chang et al. 2007; Cao et al. 2010; Bowler et al. 2010b; Schwarz
et al. 2011; Larondelle and Haase 2013).
4.2.1 Shading and Evapotranspiration Assessment
Several studies show evidence of cooler air temperature beneath individual or clusters of trees, highlighting the amount of shading as an important factor affecting
temperatures (Taha et al. 1991; Akbari et al. 1992; Bowler et al. 2010b; Schwarz
et al. 2011; Larondelle and Haase 2013). Among the indicators proposed in the literature, the tree canopy coverage, expressed as the percentage of the ground area
shaded by tree canopies relative to the total open area, is here adopted (Potchter
et al. 2006; Strohbach and Haase 2012). Accordingly, assuming a linear relationship
between the presence of tree covers and shading (Potchter et al. 2006), the assessment of the contribution of shading can be based on a visual estimation. For example, a shading score equal to “x” is assigned to an UGI with an x% tree canopy
coverage. Noteworthy, the contribution given by trees with canopy lower than two
Fig. 4.1 Flowchart of the proposed approach to assess the cooling capacity of UGI
4.2 Methods to Assess the Cooling Capacity of UGI
architecture of its components. In particular, as shown in Fig. 4.1, shading and
evapotranspiration are associated to three specific components of UGI; namely, tree
canopy coverage, soil cover, and size (Taha et al. 1991; Akbari et al. 1992; Souch
and Souch 1993; Chang et al. 2007; Cao et al. 2010; Bowler et al. 2010b; Schwarz
et al. 2011; Larondelle and Haase 2013).
4.2.1 Shading and Evapotranspiration Assessment
Several studies show evidence of cooler air temperature beneath individual or clusters of trees, highlighting the amount of shading as an important factor affecting
temperatures (Taha et al. 1991; Akbari et al. 1992; Bowler et al. 2010b; Schwarz
et al. 2011; Larondelle and Haase 2013). Among the indicators proposed in the literature, the tree canopy coverage, expressed as the percentage of the ground area
shaded by tree canopies relative to the total open area, is here adopted (Potchter
et al. 2006; Strohbach and Haase 2012). Accordingly, assuming a linear relationship
between the presence of tree covers and shading (Potchter et al. 2006), the assessment of the contribution of shading can be based on a visual estimation. For example, a shading score equal to “x” is assigned to an UGI with an x% tree canopy
coverage. Noteworthy, the contribution given by trees with canopy lower than two
Fig. 4.1 Flowchart of the proposed approach to assess the cooling capacity of UGI
4.2 Methods to Assess the Cooling Capacity of UGI