

9
2.2.2 Assessing the Quality of Inclusion
Quality is conceptualized as the presence of desired characteristics, described
through criteria that high-quality plans are expected to meet (Berke and Godschalk
2009). We built on the scoring protocol developed by Baker et al. (2012), and
adopted a 5-point scale, with scores ranging from 0 (no inclusion) to 4 (high-quality
inclusion). A plan is awarded the highest score in the information base component
when it acknowledges the links between ecosystems and human wellbeing, identifies functions and processes that determine the provision of ES, and applies this
knowledge to a quantitative assessment of the local provision that also includes an
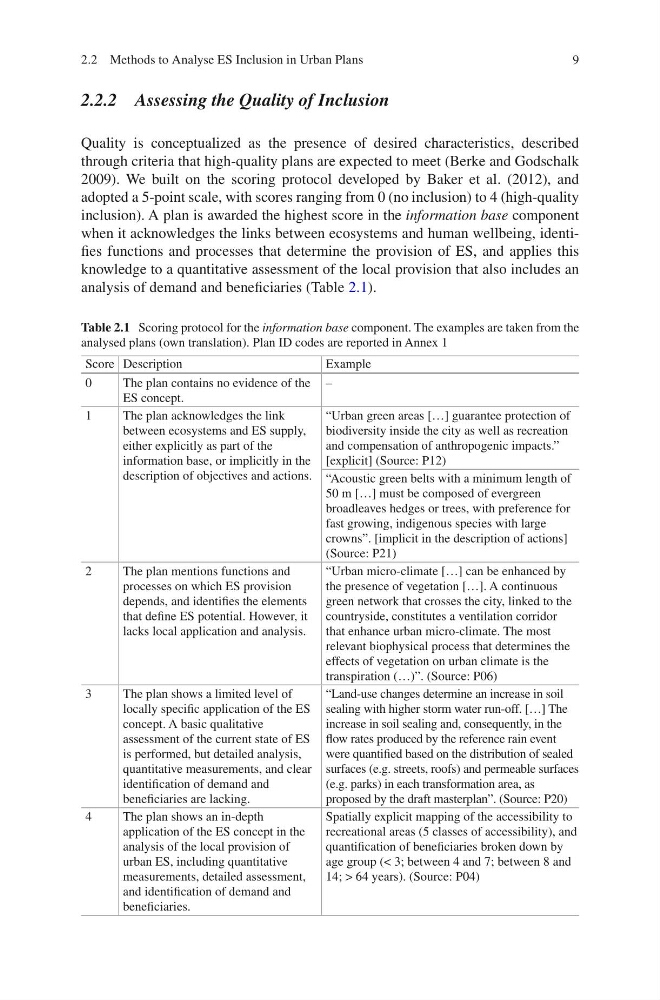
analysis of demand and beneficiaries (Table 2.1).
Table 2.1 Scoring protocol for the information base component. The examples are taken from the
analysed plans (own translation). Plan ID codes are reported in Annex 1
Score Description
Example
0
The plan contains no evidence of the
ES concept.
–
1
The plan acknowledges the link
between ecosystems and ES supply,
either explicitly as part of the
information base, or implicitly in the
description of objectives and actions.
“Urban green areas […] guarantee protection of
biodiversity inside the city as well as recreation
and compensation of anthropogenic impacts.”
[explicit] (Source: P12)
“Acoustic green belts with a minimum length of
50 m […] must be composed of evergreen
broadleaves hedges or trees, with preference for
fast growing, indigenous species with large
crowns”. [implicit in the description of actions]
(Source: P21)
2
The plan mentions functions and
processes on which ES provision
depends, and identifies the elements
that define ES potential. However, it
lacks local application and analysis.
“Urban micro-climate […] can be enhanced by
the presence of vegetation […]. A continuous
green network that crosses the city, linked to the
countryside, constitutes a ventilation corridor
that enhance urban micro-climate. The most
relevant biophysical process that determines the
effects of vegetation on urban climate is the
transpiration (…)”. (Source: P06)
3
The plan shows a limited level of
locally specific application of the ES
concept. A basic qualitative
assessment of the current state of ES
is performed, but detailed analysis,
quantitative measurements, and clear
identification of demand and
beneficiaries are lacking.
“Land-use changes determine an increase in soil
sealing with higher storm water run-off. […] The
increase in soil sealing and, consequently, in the
flow rates produced by the reference rain event
were quantified based on the distribution of sealed
surfaces (e.g. streets, roofs) and permeable surfaces
(e.g. parks) in each transformation area, as
proposed by the draft masterplan”. (Source: P20)
4
The plan shows an in-depth
application of the ES concept in the
analysis of the local provision of
urban ES, including quantitative
measurements, detailed assessment,
and identification of demand and
beneficiaries.
Spatially explicit mapping of the accessibility to
recreational areas (5 classes of accessibility), and
quantification of beneficiaries broken down by
age group (< 3; between 4 and 7; between 8 and
14; > 64 years). (Source: P04)
2.2 Methods to Analyse ES Inclusion in Urban Plans
2.2.2 Assessing the Quality of Inclusion
Quality is conceptualized as the presence of desired characteristics, described
through criteria that high-quality plans are expected to meet (Berke and Godschalk
2009). We built on the scoring protocol developed by Baker et al. (2012), and
adopted a 5-point scale, with scores ranging from 0 (no inclusion) to 4 (high-quality
inclusion). A plan is awarded the highest score in the information base component
when it acknowledges the links between ecosystems and human wellbeing, identifies functions and processes that determine the provision of ES, and applies this
knowledge to a quantitative assessment of the local provision that also includes an
analysis of demand and beneficiaries (Table 2.1).
Table 2.1 Scoring protocol for the information base component. The examples are taken from the
analysed plans (own translation). Plan ID codes are reported in Annex 1
Score Description
Example
0
The plan contains no evidence of the
ES concept.
–
1
The plan acknowledges the link
between ecosystems and ES supply,
either explicitly as part of the
information base, or implicitly in the
description of objectives and actions.
“Urban green areas […] guarantee protection of
biodiversity inside the city as well as recreation
and compensation of anthropogenic impacts.”
[explicit] (Source: P12)
“Acoustic green belts with a minimum length of
50 m […] must be composed of evergreen
broadleaves hedges or trees, with preference for
fast growing, indigenous species with large
crowns”. [implicit in the description of actions]
(Source: P21)
2
The plan mentions functions and
processes on which ES provision
depends, and identifies the elements
that define ES potential. However, it
lacks local application and analysis.
“Urban micro-climate […] can be enhanced by
the presence of vegetation […]. A continuous
green network that crosses the city, linked to the
countryside, constitutes a ventilation corridor
that enhance urban micro-climate. The most
relevant biophysical process that determines the
effects of vegetation on urban climate is the
transpiration (…)”. (Source: P06)
3
The plan shows a limited level of
locally specific application of the ES
concept. A basic qualitative
assessment of the current state of ES
is performed, but detailed analysis,
quantitative measurements, and clear
identification of demand and
beneficiaries are lacking.
“Land-use changes determine an increase in soil
sealing with higher storm water run-off. […] The
increase in soil sealing and, consequently, in the
flow rates produced by the reference rain event
were quantified based on the distribution of sealed
surfaces (e.g. streets, roofs) and permeable surfaces
(e.g. parks) in each transformation area, as
proposed by the draft masterplan”. (Source: P20)
4
The plan shows an in-depth
application of the ES concept in the
analysis of the local provision of
urban ES, including quantitative
measurements, detailed assessment,
and identification of demand and
beneficiaries.
Spatially explicit mapping of the accessibility to
recreational areas (5 classes of accessibility), and
quantification of beneficiaries broken down by
age group (< 3; between 4 and 7; between 8 and
14; > 64 years). (Source: P04)
2.2 Methods to Analyse ES Inclusion in Urban Plans