

602
Y. Li and D. Goyal
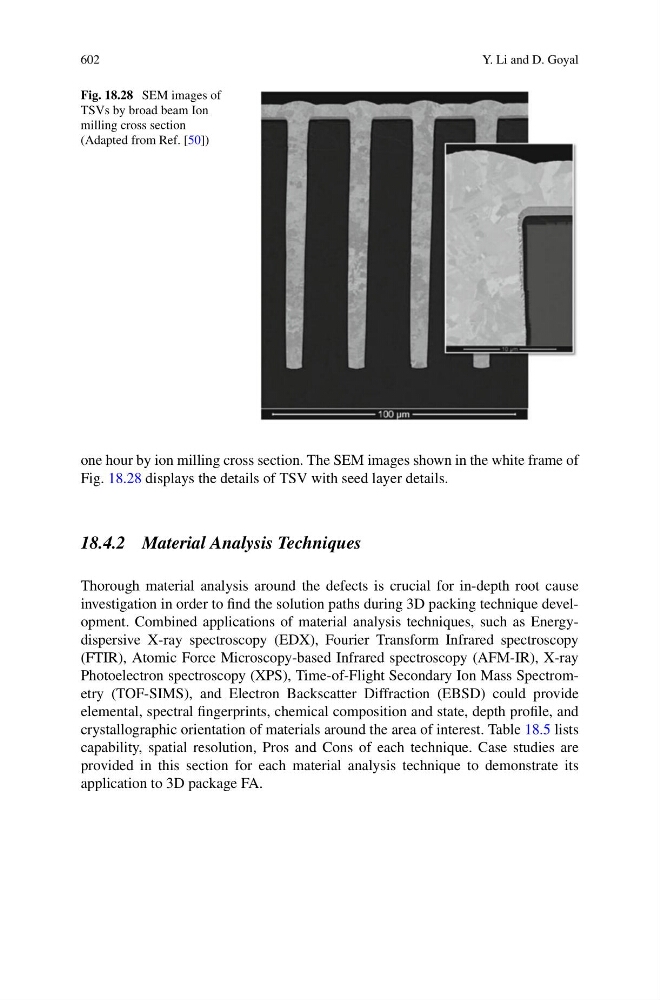
Fig. 18.28 SEM images of
TSVs by broad beam Ion
milling cross section
(Adapted from Ref. [50])
one hour by ion milling cross section. The SEM images shown in the white frame of
Fig. 18.28 displays the details of TSV with seed layer details.
18.4.2 Material Analysis Techniques
Thorough material analysis around the defects is crucial for in-depth root cause
investigation in order to find the solution paths during 3D packing technique development. Combined applications of material analysis techniques, such as Energydispersive X-ray spectroscopy (EDX), Fourier Transform Infrared spectroscopy
(FTIR), Atomic Force Microscopy-based Infrared spectroscopy (AFM-IR), X-ray
Photoelectron spectroscopy (XPS), Time-of-Flight Secondary Ion Mass Spectrometry (TOF-SIMS), and Electron Backscatter Diffraction (EBSD) could provide
elemental, spectral fingerprints, chemical composition and state, depth profile, and
crystallographic orientation of materials around the area of interest. Table 18.5 lists
capability, spatial resolution, Pros and Cons of each technique. Case studies are
provided in this section for each material analysis technique to demonstrate its
application to 3D package FA.