

184
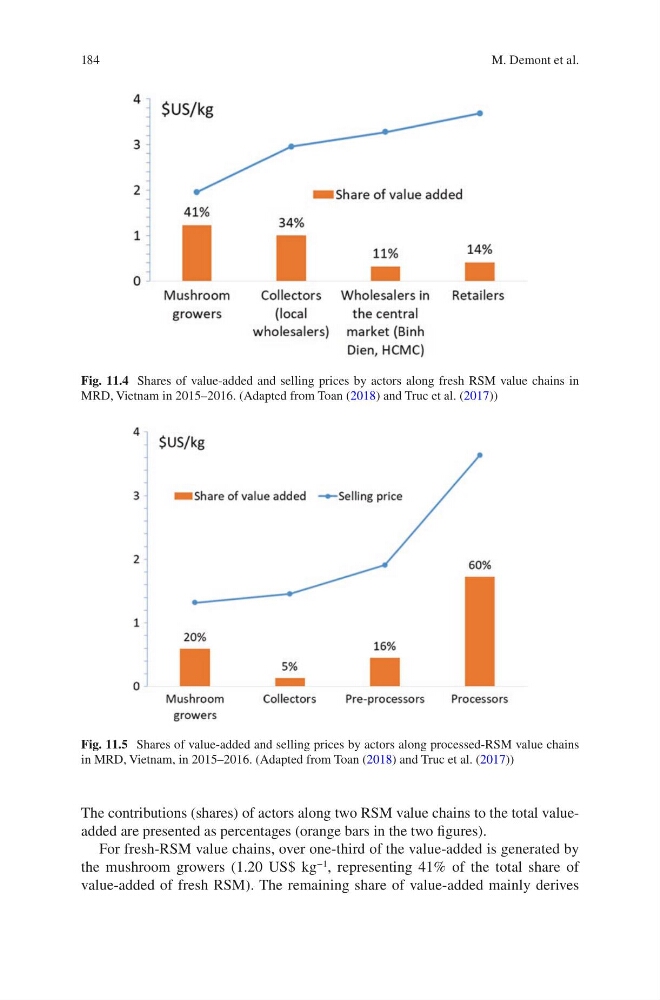
Fig. 11.4 Shares of value-added and selling prices by actors along fresh RSM value chains in
MRD, Vietnam in 2015–2016. (Adapted from Toan (2018) and Truc et al. (2017))
Fig. 11.5 Shares of value-added and selling prices by actors along processed-RSM value chains
in MRD, Vietnam, in 2015–2016. (Adapted from Toan (2018) and Truc et al. (2017))
The contributions (shares) of actors along two RSM value chains to the total valueadded are presented as percentages (orange bars in the two figures).
For fresh-RSM value chains, over one-third of the value-added is generated by
the mushroom growers (1.20 US$ kg
−1
, representing 41% of the total share of
value- added of fresh RSM). The remaining share of value-added mainly derives
M. Demont et al.
Fig. 11.4 Shares of value-added and selling prices by actors along fresh RSM value chains in
MRD, Vietnam in 2015–2016. (Adapted from Toan (2018) and Truc et al. (2017))
Fig. 11.5 Shares of value-added and selling prices by actors along processed-RSM value chains
in MRD, Vietnam, in 2015–2016. (Adapted from Toan (2018) and Truc et al. (2017))
The contributions (shares) of actors along two RSM value chains to the total valueadded are presented as percentages (orange bars in the two figures).
For fresh-RSM value chains, over one-third of the value-added is generated by
the mushroom growers (1.20 US$ kg
−1
, representing 41% of the total share of
value- added of fresh RSM). The remaining share of value-added mainly derives
M. Demont et al.