

cultivation) in the village, in this year?” Implicit in this question is the understanding that the village has agricultural land that has been left fallow. Thus the
percentage of land cultivated in time t, by village i, is assumed to be defined as:
% of land cultivated at time t in village i ¼ [(Total land cleared and potentially fit
for cultivation À Area left fallow at time t by village i)/Total land cleared and
potentially fit for cultivation] Â 100
I now discuss the hypothesized effect of village level variables on total agricultural
area and on agricultural intensity.
Village Population Village population is expected to have two types of effects on
total village agricultural area and cultivation intensity. The first is a scale effect: A
village with a larger number of households is expected to have a higher demand for
agricultural land compared to one with a fewer households. The second effect is the
‘food’ (or subsistence) effect. A larger population also means larger subsistence
requirements. The subsistence effect is likely to be stronger for food crops in
villages located far from the market because it is not possible to buy food from
the market. Both these effects are expected to be in the same direction.
Travel Time to Market Travel time to the market is a proxy for the cost of
transporting crops to the market and obtaining inputs from the market. I expect that
farmers that are located far from the market are able to exercise less leverage in
getting the best prices for their produce; are unable to spend much time searching
for best bargains; are less willing to carry their produce back if a transaction does
not go through; and, are likely to have limited access to information about markets.
20 Thus travel time is also a proxy for search costs, bargaining costs and,
generally, costs of not being located in situ. Thus, for crops that are produced for the
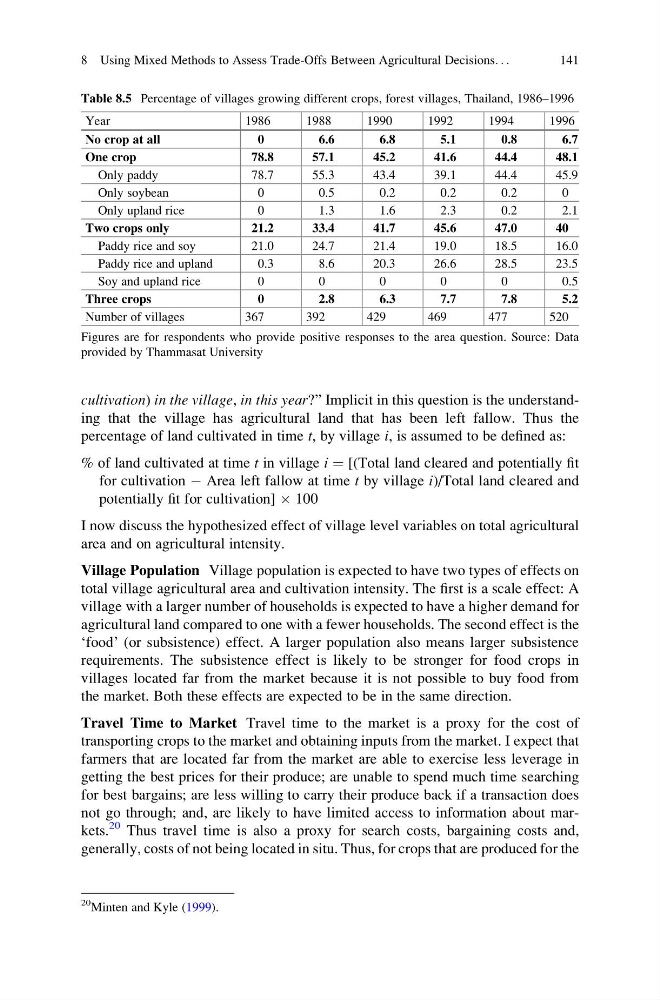
Table 8.5 Percentage of villages growing different crops, forest villages, Thailand, 1986–1996
Year
1986
1988
1990
1992
1994
1996
No crop at all
0
6.6
6.8
5.1
0.8
6.7
One crop
78.8
57.1
45.2
41.6
44.4
48.1
Only paddy
78.7
55.3
43.4
39.1
44.4
45.9
Only soybean
0
0.5
0.2
0.2
0.2
0
Only upland rice
0
1.3
1.6
2.3
0.2
2.1
Two crops only
21.2
33.4
41.7
45.6
47.0
40
Paddy rice and soy
21.0
24.7
21.4
19.0
18.5
16.0
Paddy rice and upland
0.3
8.6
20.3
26.6
28.5
23.5
Soy and upland rice
0
0
0
0
0
0 . 5
Three crops
0
2.8
6.3
7.7
7.8
5.2
Number of villages
367
392
429
469
477
520
Figures are for respondents who provide positive responses to the area question. Source: Data
provided by Thammasat University
20 Minten and Kyle (1999).
8 Using Mixed Methods to Assess Trade-Offs Between Agricultural Decisions. . .
141
percentage of land cultivated in time t, by village i, is assumed to be defined as:
% of land cultivated at time t in village i ¼ [(Total land cleared and potentially fit
for cultivation À Area left fallow at time t by village i)/Total land cleared and
potentially fit for cultivation] Â 100
I now discuss the hypothesized effect of village level variables on total agricultural
area and on agricultural intensity.
Village Population Village population is expected to have two types of effects on
total village agricultural area and cultivation intensity. The first is a scale effect: A
village with a larger number of households is expected to have a higher demand for
agricultural land compared to one with a fewer households. The second effect is the
‘food’ (or subsistence) effect. A larger population also means larger subsistence
requirements. The subsistence effect is likely to be stronger for food crops in
villages located far from the market because it is not possible to buy food from
the market. Both these effects are expected to be in the same direction.
Travel Time to Market Travel time to the market is a proxy for the cost of
transporting crops to the market and obtaining inputs from the market. I expect that
farmers that are located far from the market are able to exercise less leverage in
getting the best prices for their produce; are unable to spend much time searching
for best bargains; are less willing to carry their produce back if a transaction does
not go through; and, are likely to have limited access to information about markets.
20 Thus travel time is also a proxy for search costs, bargaining costs and,
generally, costs of not being located in situ. Thus, for crops that are produced for the
Table 8.5 Percentage of villages growing different crops, forest villages, Thailand, 1986–1996
Year
1986
1988
1990
1992
1994
1996
No crop at all
0
6.6
6.8
5.1
0.8
6.7
One crop
78.8
57.1
45.2
41.6
44.4
48.1
Only paddy
78.7
55.3
43.4
39.1
44.4
45.9
Only soybean
0
0.5
0.2
0.2
0.2
0
Only upland rice
0
1.3
1.6
2.3
0.2
2.1
Two crops only
21.2
33.4
41.7
45.6
47.0
40
Paddy rice and soy
21.0
24.7
21.4
19.0
18.5
16.0
Paddy rice and upland
0.3
8.6
20.3
26.6
28.5
23.5
Soy and upland rice
0
0
0
0
0
0 . 5
Three crops
0
2.8
6.3
7.7
7.8
5.2
Number of villages
367
392
429
469
477
520
Figures are for respondents who provide positive responses to the area question. Source: Data
provided by Thammasat University
20 Minten and Kyle (1999).
8 Using Mixed Methods to Assess Trade-Offs Between Agricultural Decisions. . .
141