

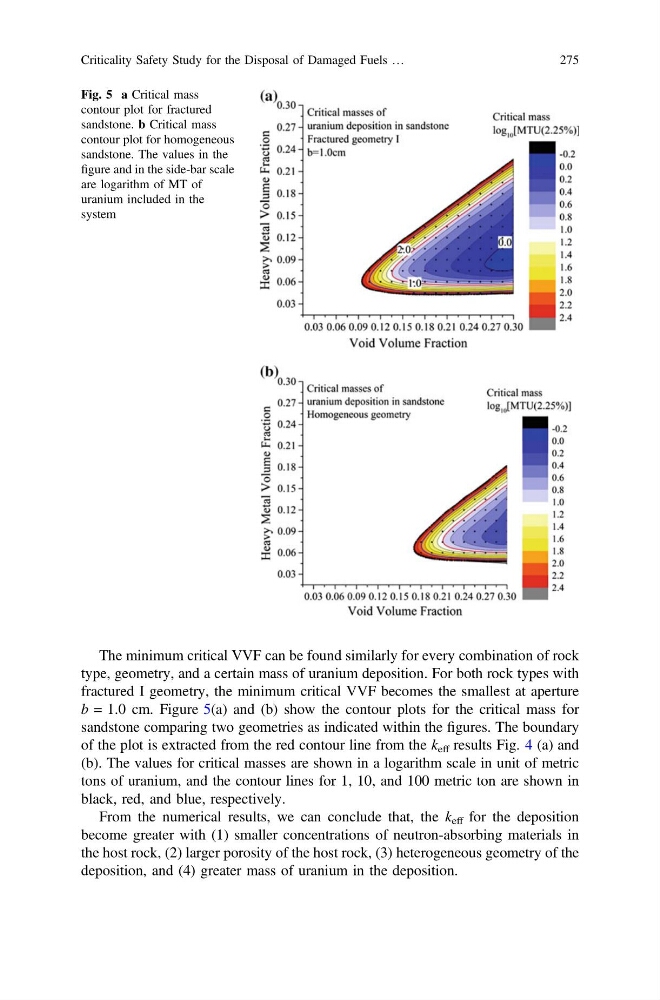
The minimum critical VVF can be found similarly for every combination of rock
type, geometry, and a certain mass of uranium deposition. For both rock types with
fractured I geometry, the minimum critical VVF becomes the smallest at aperture
b = 1.0 cm. Figure 5(a) and (b) show the contour plots for the critical mass for
sandstone comparing two geometries as indicated within the figures. The boundary
of the plot is extracted from the red contour line from the k eff results Fig. 4 (a) and
(b). The values for critical masses are shown in a logarithm scale in unit of metric
tons of uranium, and the contour lines for 1, 10, and 100 metric ton are shown in
black, red, and blue, respectively.
From the numerical results, we can conclude that, the k eff for the deposition
become greater with (1) smaller concentrations of neutron-absorbing materials in
the host rock, (2) larger porosity of the host rock, (3) heterogeneous geometry of the
deposition, and (4) greater mass of uranium in the deposition.
Fig. 5 a Critical mass
contour plot for fractured
sandstone. b Critical mass
contour plot for homogeneous
sandstone. The values in the
figure and in the side-bar scale
are logarithm of MT of
uranium included in the
system
Criticality Safety Study for the Disposal of Damaged Fuels …
275
type, geometry, and a certain mass of uranium deposition. For both rock types with
fractured I geometry, the minimum critical VVF becomes the smallest at aperture
b = 1.0 cm. Figure 5(a) and (b) show the contour plots for the critical mass for
sandstone comparing two geometries as indicated within the figures. The boundary
of the plot is extracted from the red contour line from the k eff results Fig. 4 (a) and
(b). The values for critical masses are shown in a logarithm scale in unit of metric
tons of uranium, and the contour lines for 1, 10, and 100 metric ton are shown in
black, red, and blue, respectively.
From the numerical results, we can conclude that, the k eff for the deposition
become greater with (1) smaller concentrations of neutron-absorbing materials in
the host rock, (2) larger porosity of the host rock, (3) heterogeneous geometry of the
deposition, and (4) greater mass of uranium in the deposition.
Fig. 5 a Critical mass
contour plot for fractured
sandstone. b Critical mass
contour plot for homogeneous
sandstone. The values in the
figure and in the side-bar scale
are logarithm of MT of
uranium included in the
system
Criticality Safety Study for the Disposal of Damaged Fuels …
275