

26 Phase Coherence Between Cardiovascular Oscillations in Malaria …
411
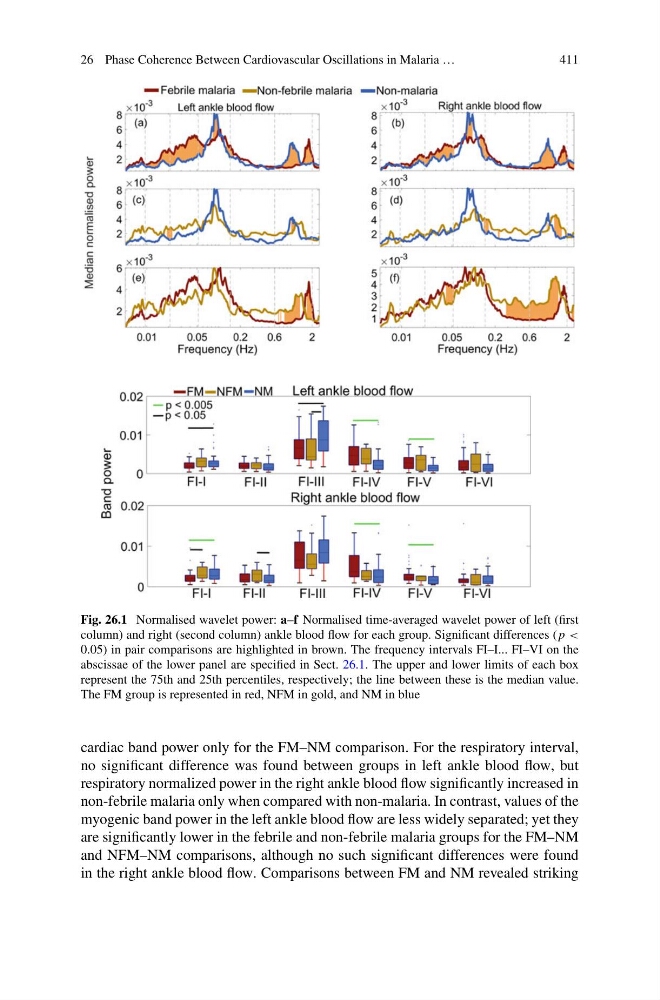
Fig. 26.1 Normalised wavelet power: a–f Normalised time-averaged wavelet power of left (first
column) and right (second column) ankle blood flow for each group. Significant differences ( p <
0.05) in pair comparisons are highlighted in brown. The frequency intervals FI–I... FI–VI on the
abscissae of the lower panel are specified in Sect. 26.1. The upper and lower limits of each box
represent the 75th and 25th percentiles, respectively; the line between these is the median value.
The FM group is represented in red, NFM in gold, and NM in blue
cardiac band power only for the FM–NM comparison. For the respiratory interval,
no significant difference was found between groups in left ankle blood flow, but
respiratory normalized power in the right ankle blood flow significantly increased in
non-febrile malaria only when compared with non-malaria. In contrast, values of the
myogenic band power in the left ankle blood flow are less widely separated; yet they
are significantly lower in the febrile and non-febrile malaria groups for the FM–NM
and NFM–NM comparisons, although no such significant differences were found
in the right ankle blood flow. Comparisons between FM and NM revealed striking
411
Fig. 26.1 Normalised wavelet power: a–f Normalised time-averaged wavelet power of left (first
column) and right (second column) ankle blood flow for each group. Significant differences ( p <
0.05) in pair comparisons are highlighted in brown. The frequency intervals FI–I... FI–VI on the
abscissae of the lower panel are specified in Sect. 26.1. The upper and lower limits of each box
represent the 75th and 25th percentiles, respectively; the line between these is the median value.
The FM group is represented in red, NFM in gold, and NM in blue
cardiac band power only for the FM–NM comparison. For the respiratory interval,
no significant difference was found between groups in left ankle blood flow, but
respiratory normalized power in the right ankle blood flow significantly increased in
non-febrile malaria only when compared with non-malaria. In contrast, values of the
myogenic band power in the left ankle blood flow are less widely separated; yet they
are significantly lower in the febrile and non-febrile malaria groups for the FM–NM
and NFM–NM comparisons, although no such significant differences were found
in the right ankle blood flow. Comparisons between FM and NM revealed striking