

19 Complexity-Based Analysis of Microvascular Blood …
301
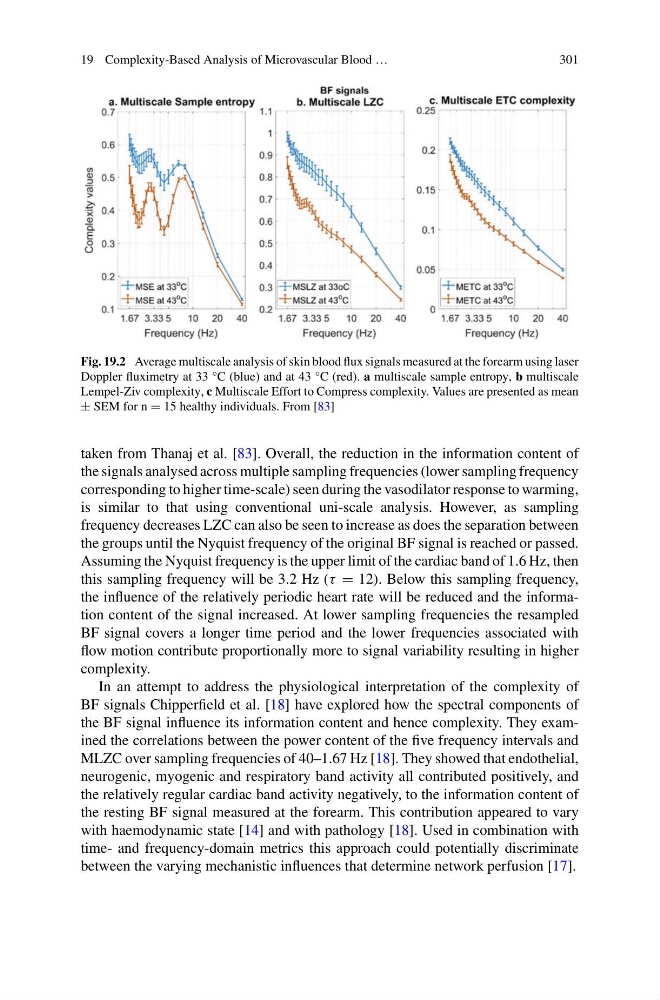
Fig. 19.2 Average multiscale analysis of skin blood flux signals measured at the forearm using laser
Doppler fluximetry at 33 °C (blue) and at 43 °C (red). a multiscale sample entropy, b multiscale
Lempel-Ziv complexity, c Multiscale Effort to Compress complexity. Values are presented as mean
± SEM for n = 15 healthy individuals. From [83]
taken from Thanaj et al. [83]. Overall, the reduction in the information content of
the signals analysed across multiple sampling frequencies (lower sampling frequency
corresponding to higher time-scale) seen during the vasodilator response to warming,
is similar to that using conventional uni-scale analysis. However, as sampling
frequency decreases LZC can also be seen to increase as does the separation between
the groups until the Nyquist frequency of the original BF signal is reached or passed.
Assuming the Nyquist frequency is the upper limit of the cardiac band of 1.6 Hz, then
this sampling frequency will be 3.2 Hz (τ = 12). Below this sampling frequency,
the influence of the relatively periodic heart rate will be reduced and the information content of the signal increased. At lower sampling frequencies the resampled
BF signal covers a longer time period and the lower frequencies associated with
flow motion contribute proportionally more to signal variability resulting in higher
complexity.
In an attempt to address the physiological interpretation of the complexity of
BF signals Chipperfield et al. [18] have explored how the spectral components of
the BF signal influence its information content and hence complexity. They examined the correlations between the power content of the five frequency intervals and
MLZC over sampling frequencies of 40–1.67 Hz [18]. They showed that endothelial,
neurogenic, myogenic and respiratory band activity all contributed positively, and
the relatively regular cardiac band activity negatively, to the information content of
the resting BF signal measured at the forearm. This contribution appeared to vary
with haemodynamic state [14] and with pathology [18]. Used in combination with
time- and frequency-domain metrics this approach could potentially discriminate
between the varying mechanistic influences that determine network perfusion [17].
301
Fig. 19.2 Average multiscale analysis of skin blood flux signals measured at the forearm using laser
Doppler fluximetry at 33 °C (blue) and at 43 °C (red). a multiscale sample entropy, b multiscale
Lempel-Ziv complexity, c Multiscale Effort to Compress complexity. Values are presented as mean
± SEM for n = 15 healthy individuals. From [83]
taken from Thanaj et al. [83]. Overall, the reduction in the information content of
the signals analysed across multiple sampling frequencies (lower sampling frequency
corresponding to higher time-scale) seen during the vasodilator response to warming,
is similar to that using conventional uni-scale analysis. However, as sampling
frequency decreases LZC can also be seen to increase as does the separation between
the groups until the Nyquist frequency of the original BF signal is reached or passed.
Assuming the Nyquist frequency is the upper limit of the cardiac band of 1.6 Hz, then
this sampling frequency will be 3.2 Hz (τ = 12). Below this sampling frequency,
the influence of the relatively periodic heart rate will be reduced and the information content of the signal increased. At lower sampling frequencies the resampled
BF signal covers a longer time period and the lower frequencies associated with
flow motion contribute proportionally more to signal variability resulting in higher
complexity.
In an attempt to address the physiological interpretation of the complexity of
BF signals Chipperfield et al. [18] have explored how the spectral components of
the BF signal influence its information content and hence complexity. They examined the correlations between the power content of the five frequency intervals and
MLZC over sampling frequencies of 40–1.67 Hz [18]. They showed that endothelial,
neurogenic, myogenic and respiratory band activity all contributed positively, and
the relatively regular cardiac band activity negatively, to the information content of
the resting BF signal measured at the forearm. This contribution appeared to vary
with haemodynamic state [14] and with pathology [18]. Used in combination with
time- and frequency-domain metrics this approach could potentially discriminate
between the varying mechanistic influences that determine network perfusion [17].