

19 Complexity-Based Analysis of Microvascular Blood …
297
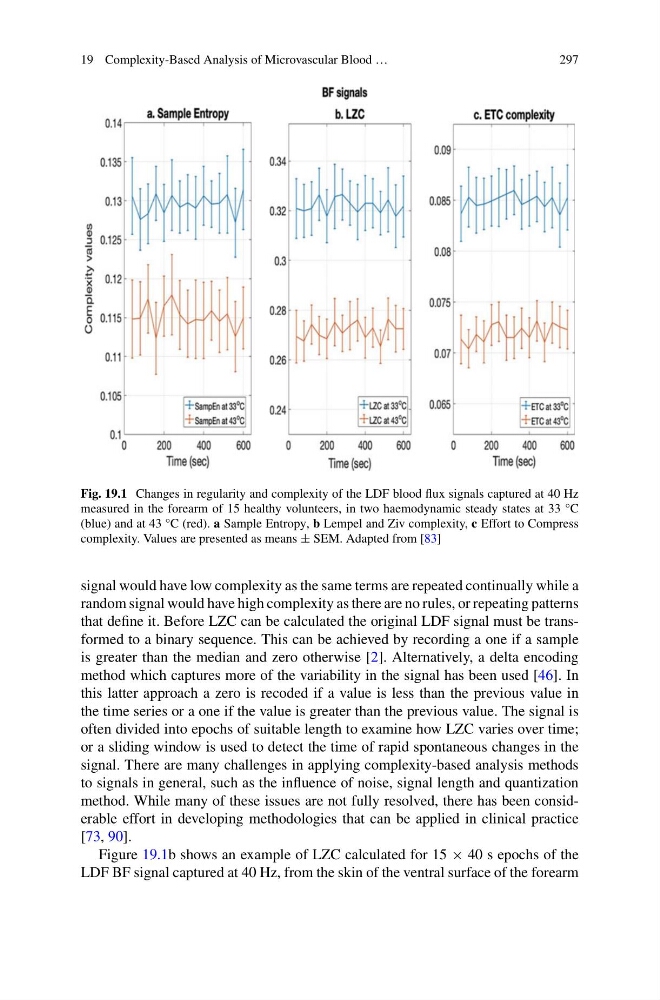
Fig. 19.1 Changes in regularity and complexity of the LDF blood flux signals captured at 40 Hz
measured in the forearm of 15 healthy volunteers, in two haemodynamic steady states at 33 °C
(blue) and at 43 °C (red). a Sample Entropy, b Lempel and Ziv complexity, c Effort to Compress
complexity. Values are presented as means ± SEM. Adapted from [83]
signal would have low complexity as the same terms are repeated continually while a
random signal would have high complexity as there are no rules, or repeating patterns
that define it. Before LZC can be calculated the original LDF signal must be transformed to a binary sequence. This can be achieved by recording a one if a sample
is greater than the median and zero otherwise [2]. Alternatively, a delta encoding
method which captures more of the variability in the signal has been used [46]. In
this latter approach a zero is recoded if a value is less than the previous value in
the time series or a one if the value is greater than the previous value. The signal is
often divided into epochs of suitable length to examine how LZC varies over time;
or a sliding window is used to detect the time of rapid spontaneous changes in the
signal. There are many challenges in applying complexity-based analysis methods
to signals in general, such as the influence of noise, signal length and quantization
method. While many of these issues are not fully resolved, there has been considerable effort in developing methodologies that can be applied in clinical practice
[73, 90].
Figure 19.1b shows an example of LZC calculated for 15 × 40 s epochs of the
LDF BF signal captured at 40 Hz, from the skin of the ventral surface of the forearm
297
Fig. 19.1 Changes in regularity and complexity of the LDF blood flux signals captured at 40 Hz
measured in the forearm of 15 healthy volunteers, in two haemodynamic steady states at 33 °C
(blue) and at 43 °C (red). a Sample Entropy, b Lempel and Ziv complexity, c Effort to Compress
complexity. Values are presented as means ± SEM. Adapted from [83]
signal would have low complexity as the same terms are repeated continually while a
random signal would have high complexity as there are no rules, or repeating patterns
that define it. Before LZC can be calculated the original LDF signal must be transformed to a binary sequence. This can be achieved by recording a one if a sample
is greater than the median and zero otherwise [2]. Alternatively, a delta encoding
method which captures more of the variability in the signal has been used [46]. In
this latter approach a zero is recoded if a value is less than the previous value in
the time series or a one if the value is greater than the previous value. The signal is
often divided into epochs of suitable length to examine how LZC varies over time;
or a sliding window is used to detect the time of rapid spontaneous changes in the
signal. There are many challenges in applying complexity-based analysis methods
to signals in general, such as the influence of noise, signal length and quantization
method. While many of these issues are not fully resolved, there has been considerable effort in developing methodologies that can be applied in clinical practice
[73, 90].
Figure 19.1b shows an example of LZC calculated for 15 × 40 s epochs of the
LDF BF signal captured at 40 Hz, from the skin of the ventral surface of the forearm