

18 Phase Coherence of Finger Skin Blood Flow …
283
constant and amounted to 40% of the maximal chest excursion. The duration of all
signals was 300 s.
The depth, form and rate of respiratory movements (pneumogram) were registered
using a strip-chart detector fastened to the chest of the subject. The analog signal
from the detector was digitized and displayed at the monitor. The subject adjusted
the depth, form and rate of her chest excursions so that the breathing curve was
superposed with a reference curve demonstrated on the monitor. As the reference, a
sinusoidal curve with a given frequency and amplitude was used.
Skin blood perfusion was registered by laser Doppler flowmeter LAKK-02
(LAZMA, Russia) with two identical probes (wavelength 0.63 µm; emission power,
0.5 mW). The probes were fastened to the palmar surface of the distal phalanx of
left and right forefingers. The frequency of LDF signals sampling was 16 Hz.
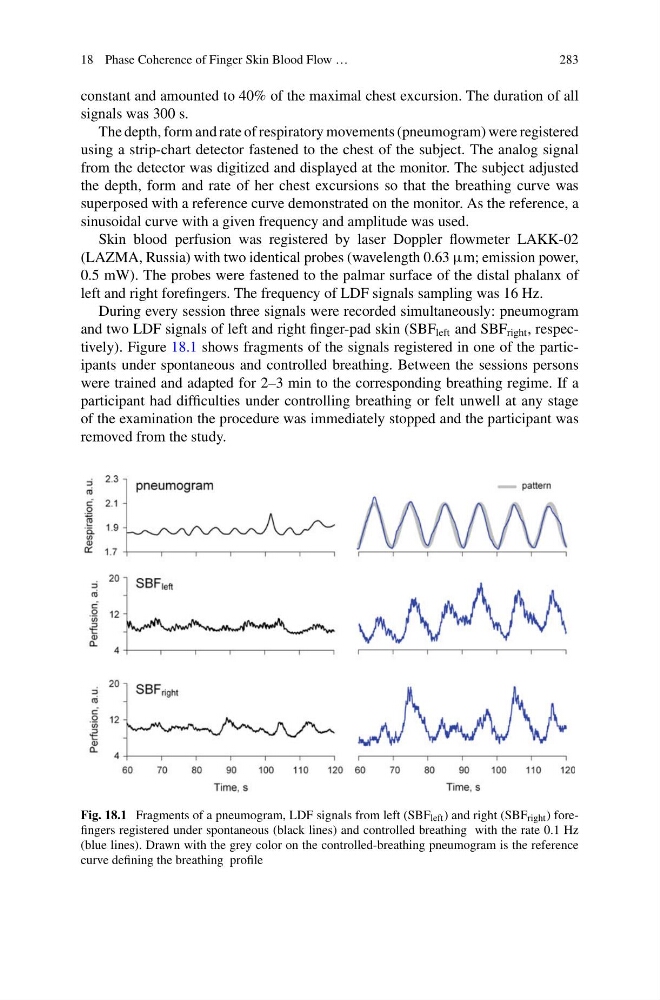
During every session three signals were recorded simultaneously: pneumogram
and two LDF signals of left and right finger-pad skin (SBF left and SBF right , respectively). Figure 18.1 shows fragments of the signals registered in one of the participants under spontaneous and controlled breathing. Between the sessions persons
were trained and adapted for 2–3 min to the corresponding breathing regime. If a
participant had difficulties under controlling breathing or felt unwell at any stage
of the examination the procedure was immediately stopped and the participant was
removed from the study.
Fig. 18.1 Fragments of a pneumogram, LDF signals from left (SBF left ) and right (SBF right ) forefingers registered under spontaneous (black lines) and controlled breathing with the rate 0.1 Hz
(blue lines). Drawn with the grey color on the controlled-breathing pneumogram is the reference
curve defining the breathing profile
283
constant and amounted to 40% of the maximal chest excursion. The duration of all
signals was 300 s.
The depth, form and rate of respiratory movements (pneumogram) were registered
using a strip-chart detector fastened to the chest of the subject. The analog signal
from the detector was digitized and displayed at the monitor. The subject adjusted
the depth, form and rate of her chest excursions so that the breathing curve was
superposed with a reference curve demonstrated on the monitor. As the reference, a
sinusoidal curve with a given frequency and amplitude was used.
Skin blood perfusion was registered by laser Doppler flowmeter LAKK-02
(LAZMA, Russia) with two identical probes (wavelength 0.63 µm; emission power,
0.5 mW). The probes were fastened to the palmar surface of the distal phalanx of
left and right forefingers. The frequency of LDF signals sampling was 16 Hz.
During every session three signals were recorded simultaneously: pneumogram
and two LDF signals of left and right finger-pad skin (SBF left and SBF right , respectively). Figure 18.1 shows fragments of the signals registered in one of the participants under spontaneous and controlled breathing. Between the sessions persons
were trained and adapted for 2–3 min to the corresponding breathing regime. If a
participant had difficulties under controlling breathing or felt unwell at any stage
of the examination the procedure was immediately stopped and the participant was
removed from the study.
Fig. 18.1 Fragments of a pneumogram, LDF signals from left (SBF left ) and right (SBF right ) forefingers registered under spontaneous (black lines) and controlled breathing with the rate 0.1 Hz
(blue lines). Drawn with the grey color on the controlled-breathing pneumogram is the reference
curve defining the breathing profile