

252
T. Amemiya et al.
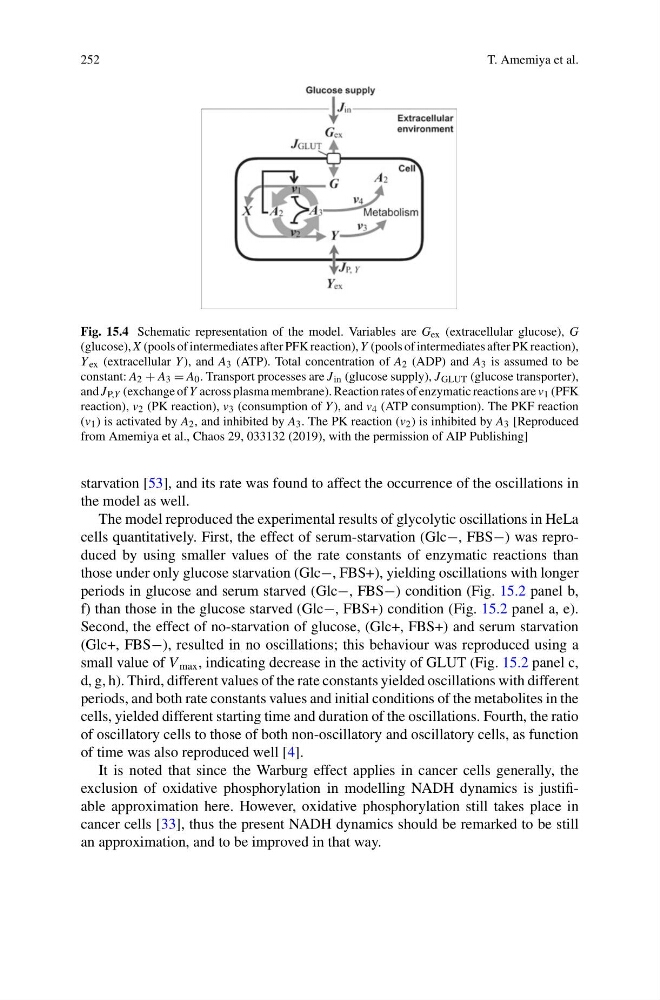
Fig. 15.4 Schematic representation of the model. Variables are G ex (extracellular glucose), G
(glucose), X (pools of intermediates after PFK reaction), Y (pools of intermediates after PK reaction),
Y ex (extracellular Y ), and A 3 (ATP). Total concentration of A 2 (ADP) and A 3 is assumed to be
constant: A 2 + A 3 = A 0 . Transport processes are J in (glucose supply), J GLUT (glucose transporter),
and J P,Y (exchange of Y across plasma membrane). Reaction rates of enzymatic reactions are v 1 (PFK
reaction), v 2 (PK reaction), v 3 (consumption of Y ), and v 4 (ATP consumption). The PKF reaction
(v 1 ) is activated by A 2 , and inhibited by A 3 . The PK reaction (v 2 ) is inhibited by A 3 [Reproduced
from Amemiya et al., Chaos 29, 033132 (2019), with the permission of AIP Publishing]
starvation [53], and its rate was found to affect the occurrence of the oscillations in
the model as well.
The model reproduced the experimental results of glycolytic oscillations in HeLa
cells quantitatively. First, the effect of serum-starvation (Glc−, FBS−) was reproduced by using smaller values of the rate constants of enzymatic reactions than
those under only glucose starvation (Glc−, FBS+), yielding oscillations with longer
periods in glucose and serum starved (Glc−, FBS−) condition (Fig. 15.2 panel b,
f) than those in the glucose starved (Glc−, FBS+) condition (Fig. 15.2 panel a, e).
Second, the effect of no-starvation of glucose, (Glc+, FBS+) and serum starvation
(Glc+, FBS−), resulted in no oscillations; this behaviour was reproduced using a
small value of V max , indicating decrease in the activity of GLUT (Fig. 15.2 panel c,
d, g, h). Third, different values of the rate constants yielded oscillations with different
periods, and both rate constants values and initial conditions of the metabolites in the
cells, yielded different starting time and duration of the oscillations. Fourth, the ratio
of oscillatory cells to those of both non-oscillatory and oscillatory cells, as function
of time was also reproduced well [4].
It is noted that since the Warburg effect applies in cancer cells generally, the
exclusion of oxidative phosphorylation in modelling NADH dynamics is justifiable approximation here. However, oxidative phosphorylation still takes place in
cancer cells [33], thus the present NADH dynamics should be remarked to be still
an approximation, and to be improved in that way.
T. Amemiya et al.
Fig. 15.4 Schematic representation of the model. Variables are G ex (extracellular glucose), G
(glucose), X (pools of intermediates after PFK reaction), Y (pools of intermediates after PK reaction),
Y ex (extracellular Y ), and A 3 (ATP). Total concentration of A 2 (ADP) and A 3 is assumed to be
constant: A 2 + A 3 = A 0 . Transport processes are J in (glucose supply), J GLUT (glucose transporter),
and J P,Y (exchange of Y across plasma membrane). Reaction rates of enzymatic reactions are v 1 (PFK
reaction), v 2 (PK reaction), v 3 (consumption of Y ), and v 4 (ATP consumption). The PKF reaction
(v 1 ) is activated by A 2 , and inhibited by A 3 . The PK reaction (v 2 ) is inhibited by A 3 [Reproduced
from Amemiya et al., Chaos 29, 033132 (2019), with the permission of AIP Publishing]
starvation [53], and its rate was found to affect the occurrence of the oscillations in
the model as well.
The model reproduced the experimental results of glycolytic oscillations in HeLa
cells quantitatively. First, the effect of serum-starvation (Glc−, FBS−) was reproduced by using smaller values of the rate constants of enzymatic reactions than
those under only glucose starvation (Glc−, FBS+), yielding oscillations with longer
periods in glucose and serum starved (Glc−, FBS−) condition (Fig. 15.2 panel b,
f) than those in the glucose starved (Glc−, FBS+) condition (Fig. 15.2 panel a, e).
Second, the effect of no-starvation of glucose, (Glc+, FBS+) and serum starvation
(Glc+, FBS−), resulted in no oscillations; this behaviour was reproduced using a
small value of V max , indicating decrease in the activity of GLUT (Fig. 15.2 panel c,
d, g, h). Third, different values of the rate constants yielded oscillations with different
periods, and both rate constants values and initial conditions of the metabolites in the
cells, yielded different starting time and duration of the oscillations. Fourth, the ratio
of oscillatory cells to those of both non-oscillatory and oscillatory cells, as function
of time was also reproduced well [4].
It is noted that since the Warburg effect applies in cancer cells generally, the
exclusion of oxidative phosphorylation in modelling NADH dynamics is justifiable approximation here. However, oxidative phosphorylation still takes place in
cancer cells [33], thus the present NADH dynamics should be remarked to be still
an approximation, and to be improved in that way.