

8 Synchronization of Coupled Oscillators—Phase Transitions …
147
a
b
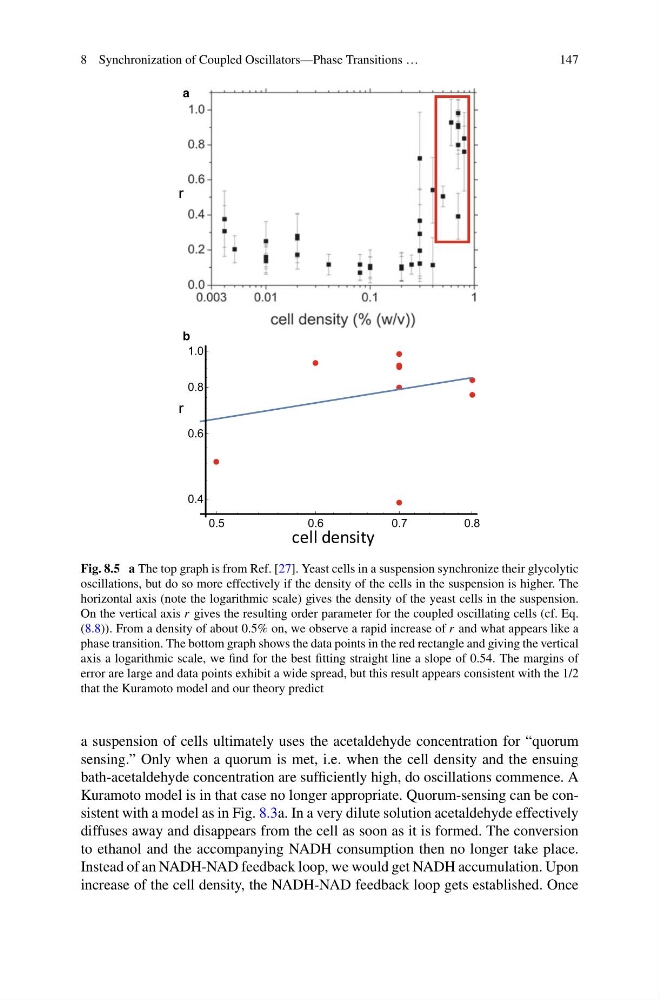
Fig. 8.5 a The top graph is from Ref. [27]. Yeast cells in a suspension synchronize their glycolytic
oscillations, but do so more effectively if the density of the cells in the suspension is higher. The
horizontal axis (note the logarithmic scale) gives the density of the yeast cells in the suspension.
On the vertical axis r gives the resulting order parameter for the coupled oscillating cells (cf. Eq.
(8.8)). From a density of about 0.5% on, we observe a rapid increase of r and what appears like a
phase transition. The bottom graph shows the data points in the red rectangle and giving the vertical
axis a logarithmic scale, we find for the best fitting straight line a slope of 0.54. The margins of
error are large and data points exhibit a wide spread, but this result appears consistent with the 1/2
that the Kuramoto model and our theory predict
a suspension of cells ultimately uses the acetaldehyde concentration for “quorum
sensing.” Only when a quorum is met, i.e. when the cell density and the ensuing
bath-acetaldehyde concentration are sufficiently high, do oscillations commence. A
Kuramoto model is in that case no longer appropriate. Quorum-sensing can be consistent with a model as in Fig. 8.3a. In a very dilute solution acetaldehyde effectively
diffuses away and disappears from the cell as soon as it is formed. The conversion
to ethanol and the accompanying NADH consumption then no longer take place.
Instead of an NADH-NAD feedback loop, we would get NADH accumulation. Upon
increase of the cell density, the NADH-NAD feedback loop gets established. Once
147
a
b
Fig. 8.5 a The top graph is from Ref. [27]. Yeast cells in a suspension synchronize their glycolytic
oscillations, but do so more effectively if the density of the cells in the suspension is higher. The
horizontal axis (note the logarithmic scale) gives the density of the yeast cells in the suspension.
On the vertical axis r gives the resulting order parameter for the coupled oscillating cells (cf. Eq.
(8.8)). From a density of about 0.5% on, we observe a rapid increase of r and what appears like a
phase transition. The bottom graph shows the data points in the red rectangle and giving the vertical
axis a logarithmic scale, we find for the best fitting straight line a slope of 0.54. The margins of
error are large and data points exhibit a wide spread, but this result appears consistent with the 1/2
that the Kuramoto model and our theory predict
a suspension of cells ultimately uses the acetaldehyde concentration for “quorum
sensing.” Only when a quorum is met, i.e. when the cell density and the ensuing
bath-acetaldehyde concentration are sufficiently high, do oscillations commence. A
Kuramoto model is in that case no longer appropriate. Quorum-sensing can be consistent with a model as in Fig. 8.3a. In a very dilute solution acetaldehyde effectively
diffuses away and disappears from the cell as soon as it is formed. The conversion
to ethanol and the accompanying NADH consumption then no longer take place.
Instead of an NADH-NAD feedback loop, we would get NADH accumulation. Upon
increase of the cell density, the NADH-NAD feedback loop gets established. Once