

ten times longer than meat remains and is very nutritious, being an advantage
compared to a meat-based diet (Houston and Copsey 1994; Margalida 2008a, b).
Thus, although the proportion of pairs that do not start laying annually is important
(range 29.4%–58.1), the decision to start breeding, which could be influenced by
the physical condition of the individual (Jenouvrier et al. 2005), appears not to
compromise the reproduction of bearded vultures. This suggests that, in this isolated population, several buffering mechanisms (e.g. changes in the structure of
breeding age, low dispersal movements and/or the availability of natural food) may
contribute to maintain stable the proportion of pairs that start laying (Sergio et al.
2011; Oro et al. 2012; Margalida et al. 2013). In this sense, the carcass disposal
policy does not seem to affect population movements because pre-adult individuals
remained in the study area without greater pre-dispersal movements (Margalida
et al. 2013). Thus, a possible explanation is related to the high food availability in
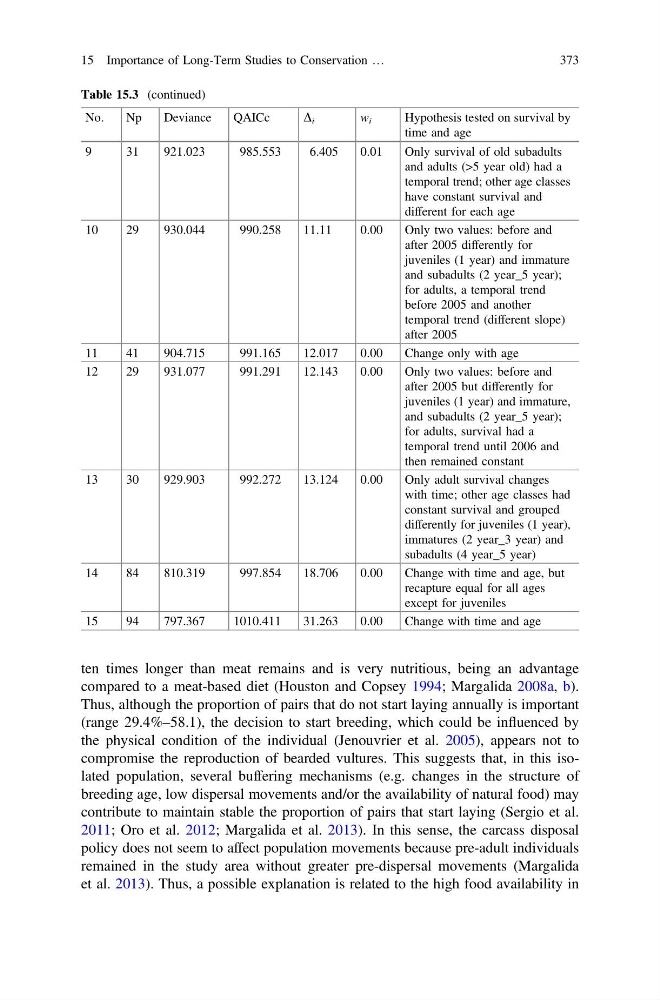
Table 15.3 (continued)
No.
Np
Deviance
QAICc
D i
w i
Hypothesis tested on survival by
time and age
9
31
921.023
985.553
6.405
0.01
Only survival of old subadults
and adults (>5 year old) had a
temporal trend; other age classes
have constant survival and
different for each age
10
29
930.044
990.258
11.11
0.00
Only two values: before and
after 2005 differently for
juveniles (1 year) and immature
and subadults (2 year_5 year);
for adults, a temporal trend
before 2005 and another
temporal trend (different slope)
after 2005
11
41
904.715
991.165
12.017
0.00
Change only with age
12
29
931.077
991.291
12.143
0.00
Only two values: before and
after 2005 but differently for
juveniles (1 year) and immature,
and subadults (2 year_5 year);
for adults, survival had a
temporal trend until 2006 and
then remained constant
13
30
929.903
992.272
13.124
0.00
Only adult survival changes
with time; other age classes had
constant survival and grouped
differently for juveniles (1 year),
immatures (2 year_3 year) and
subadults (4 year_5 year)
14
84
810.319
997.854
18.706
0.00
Change with time and age, but
recapture equal for all ages
except for juveniles
15
94
797.367
1010.411
31.263
0.00
Change with time and age
15 Importance of Long-Term Studies to Conservation …
373
compared to a meat-based diet (Houston and Copsey 1994; Margalida 2008a, b).
Thus, although the proportion of pairs that do not start laying annually is important
(range 29.4%–58.1), the decision to start breeding, which could be influenced by
the physical condition of the individual (Jenouvrier et al. 2005), appears not to
compromise the reproduction of bearded vultures. This suggests that, in this isolated population, several buffering mechanisms (e.g. changes in the structure of
breeding age, low dispersal movements and/or the availability of natural food) may
contribute to maintain stable the proportion of pairs that start laying (Sergio et al.
2011; Oro et al. 2012; Margalida et al. 2013). In this sense, the carcass disposal
policy does not seem to affect population movements because pre-adult individuals
remained in the study area without greater pre-dispersal movements (Margalida
et al. 2013). Thus, a possible explanation is related to the high food availability in
Table 15.3 (continued)
No.
Np
Deviance
QAICc
D i
w i
Hypothesis tested on survival by
time and age
9
31
921.023
985.553
6.405
0.01
Only survival of old subadults
and adults (>5 year old) had a
temporal trend; other age classes
have constant survival and
different for each age
10
29
930.044
990.258
11.11
0.00
Only two values: before and
after 2005 differently for
juveniles (1 year) and immature
and subadults (2 year_5 year);
for adults, a temporal trend
before 2005 and another
temporal trend (different slope)
after 2005
11
41
904.715
991.165
12.017
0.00
Change only with age
12
29
931.077
991.291
12.143
0.00
Only two values: before and
after 2005 but differently for
juveniles (1 year) and immature,
and subadults (2 year_5 year);
for adults, survival had a
temporal trend until 2006 and
then remained constant
13
30
929.903
992.272
13.124
0.00
Only adult survival changes
with time; other age classes had
constant survival and grouped
differently for juveniles (1 year),
immatures (2 year_3 year) and
subadults (4 year_5 year)
14
84
810.319
997.854
18.706
0.00
Change with time and age, but
recapture equal for all ages
except for juveniles
15
94
797.367
1010.411
31.263
0.00
Change with time and age
15 Importance of Long-Term Studies to Conservation …
373