

with policy change in juvenile and adult age classes (juveniles: 0.975 vs. 0.981;
adults: 0.978 vs. 0.946), but did with subadults (0.920 vs. 0.902, P = 0.0059). This
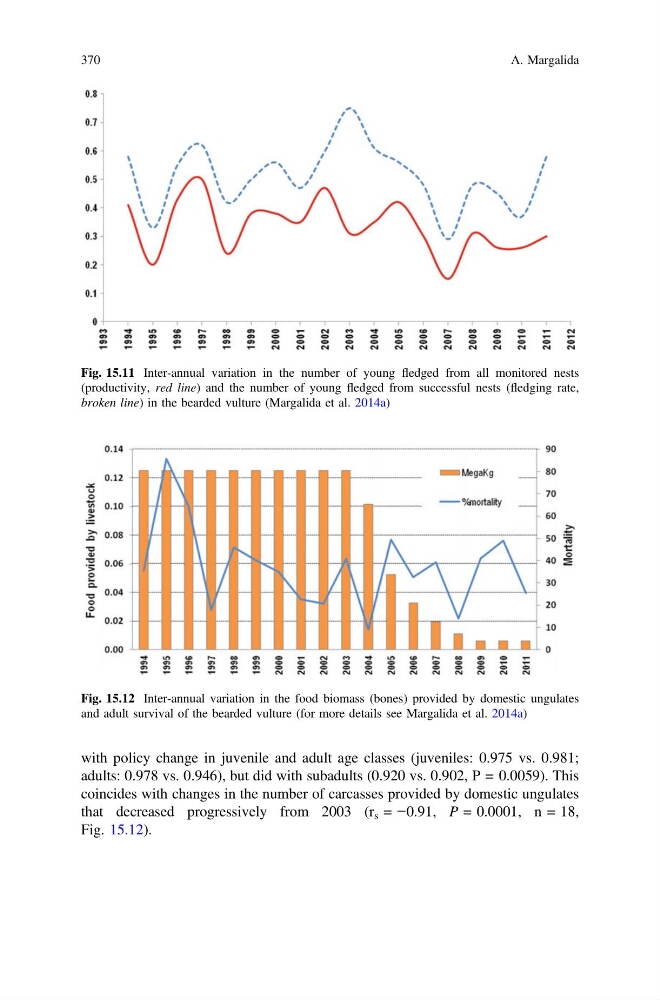
coincides with changes in the number of carcasses provided by domestic ungulates
that decreased progressively from 2003 (r s = −0.91, P = 0.0001, n = 18,
Fig. 15.12).
Fig. 15.11 Inter-annual variation in the number of young fledged from all monitored nests
(productivity, red line) and the number of young fledged from successful nests (fledging rate,
broken line) in the bearded vulture (Margalida et al. 2014a)
Fig. 15.12 Inter-annual variation in the food biomass (bones) provided by domestic ungulates
and adult survival of the bearded vulture (for more details see Margalida et al. 2014a)
370
A. Margalida
adults: 0.978 vs. 0.946), but did with subadults (0.920 vs. 0.902, P = 0.0059). This
coincides with changes in the number of carcasses provided by domestic ungulates
that decreased progressively from 2003 (r s = −0.91, P = 0.0001, n = 18,
Fig. 15.12).
Fig. 15.11 Inter-annual variation in the number of young fledged from all monitored nests
(productivity, red line) and the number of young fledged from successful nests (fledging rate,
broken line) in the bearded vulture (Margalida et al. 2014a)
Fig. 15.12 Inter-annual variation in the food biomass (bones) provided by domestic ungulates
and adult survival of the bearded vulture (for more details see Margalida et al. 2014a)
370
A. Margalida