

confer ANC to the receiving waters (Psenner 1999). Measurements of the chemical
composition of precipitation show that wet air masses coming from southern
locations exhibit higher concentration of base cations than those originated in
northern areas (Camarero and Catalan 1996).
What is the present-day situation regarding acidification in the Pyrenees?
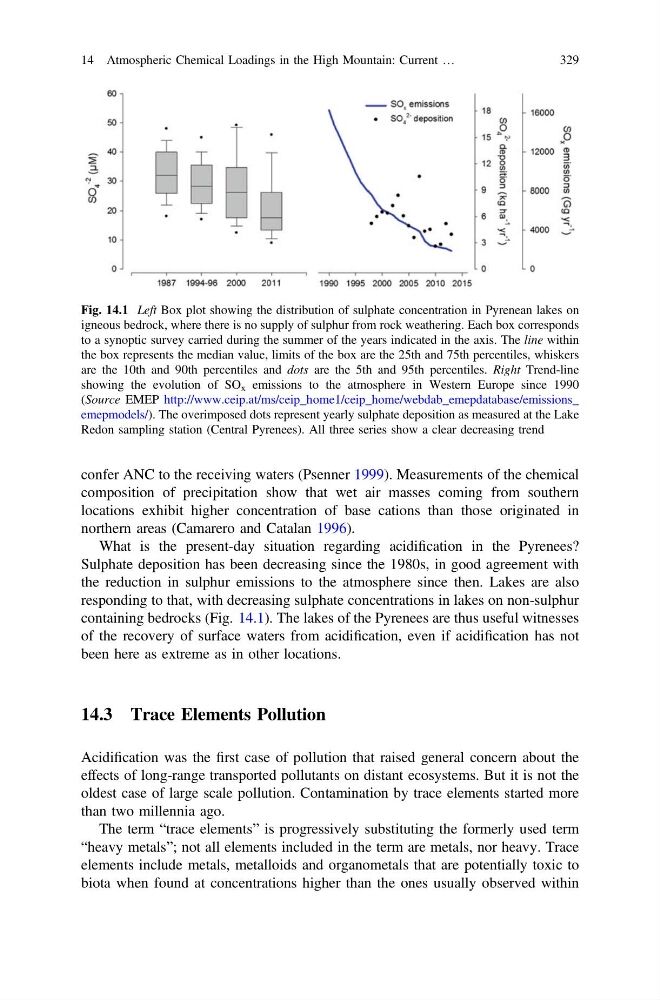
Sulphate deposition has been decreasing since the 1980s, in good agreement with
the reduction in sulphur emissions to the atmosphere since then. Lakes are also
responding to that, with decreasing sulphate concentrations in lakes on non-sulphur
containing bedrocks (Fig. 14.1). The lakes of the Pyrenees are thus useful witnesses
of the recovery of surface waters from acidification, even if acidification has not
been here as extreme as in other locations.
14.3 Trace Elements Pollution
Acidification was the first case of pollution that raised general concern about the
effects of long-range transported pollutants on distant ecosystems. But it is not the
oldest case of large scale pollution. Contamination by trace elements started more
than two millennia ago.
The term “trace elements” is progressively substituting the formerly used term
“heavy metals”; not all elements included in the term are metals, nor heavy. Trace
elements include metals, metalloids and organometals that are potentially toxic to
biota when found at concentrations higher than the ones usually observed within
Fig. 14.1 Left Box plot showing the distribution of sulphate concentration in Pyrenean lakes on
igneous bedrock, where there is no supply of sulphur from rock weathering. Each box corresponds
to a synoptic survey carried during the summer of the years indicated in the axis. The line within
the box represents the median value, limits of the box are the 25th and 75th percentiles, whiskers
are the 10th and 90th percentiles and dots are the 5th and 95th percentiles. Right Trend-line
showing the evolution of SO x emissions to the atmosphere in Western Europe since 1990
(Source EMEP http://www.ceip.at/ms/ceip_home1/ceip_home/webdab_emepdatabase/emissions_
emepmodels/). The overimposed dots represent yearly sulphate deposition as measured at the Lake
Redon sampling station (Central Pyrenees). All three series show a clear decreasing trend
14 Atmospheric Chemical Loadings in the High Mountain: Current …
329
composition of precipitation show that wet air masses coming from southern
locations exhibit higher concentration of base cations than those originated in
northern areas (Camarero and Catalan 1996).
What is the present-day situation regarding acidification in the Pyrenees?
Sulphate deposition has been decreasing since the 1980s, in good agreement with
the reduction in sulphur emissions to the atmosphere since then. Lakes are also
responding to that, with decreasing sulphate concentrations in lakes on non-sulphur
containing bedrocks (Fig. 14.1). The lakes of the Pyrenees are thus useful witnesses
of the recovery of surface waters from acidification, even if acidification has not
been here as extreme as in other locations.
14.3 Trace Elements Pollution
Acidification was the first case of pollution that raised general concern about the
effects of long-range transported pollutants on distant ecosystems. But it is not the
oldest case of large scale pollution. Contamination by trace elements started more
than two millennia ago.
The term “trace elements” is progressively substituting the formerly used term
“heavy metals”; not all elements included in the term are metals, nor heavy. Trace
elements include metals, metalloids and organometals that are potentially toxic to
biota when found at concentrations higher than the ones usually observed within
Fig. 14.1 Left Box plot showing the distribution of sulphate concentration in Pyrenean lakes on
igneous bedrock, where there is no supply of sulphur from rock weathering. Each box corresponds
to a synoptic survey carried during the summer of the years indicated in the axis. The line within
the box represents the median value, limits of the box are the 25th and 75th percentiles, whiskers
are the 10th and 90th percentiles and dots are the 5th and 95th percentiles. Right Trend-line
showing the evolution of SO x emissions to the atmosphere in Western Europe since 1990
(Source EMEP http://www.ceip.at/ms/ceip_home1/ceip_home/webdab_emepdatabase/emissions_
emepmodels/). The overimposed dots represent yearly sulphate deposition as measured at the Lake
Redon sampling station (Central Pyrenees). All three series show a clear decreasing trend
14 Atmospheric Chemical Loadings in the High Mountain: Current …
329