

M2 = 1956–1965 are used to calculated the percentage growth change at the year
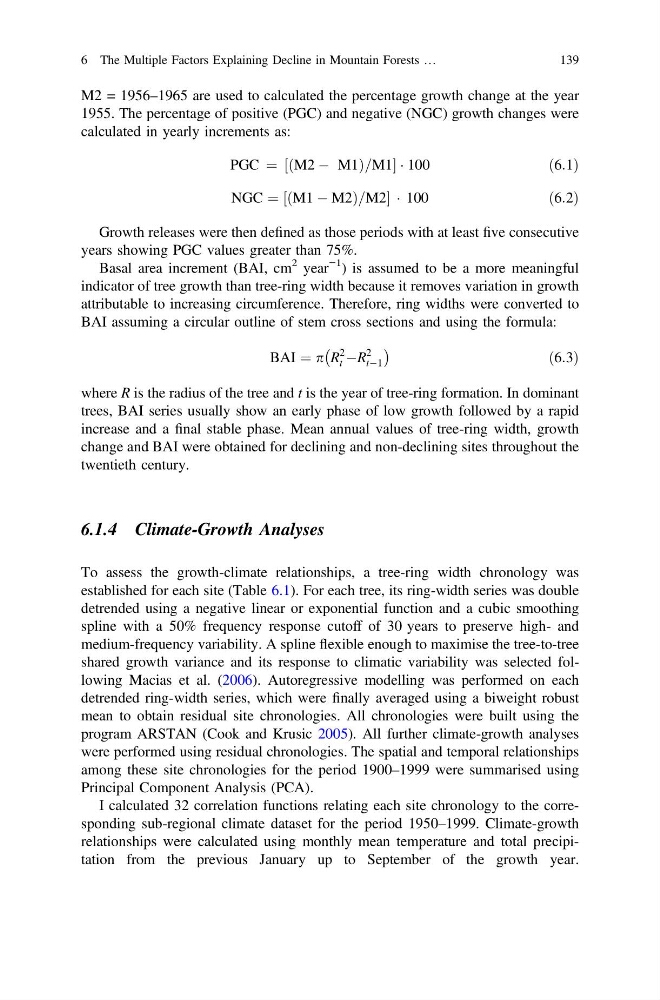
1955. The percentage of positive (PGC) and negative (NGC) growth changes were
calculated in yearly increments as:
PGC ¼ M2 À M1
ð
Þ =M1
½
Á 100
ð6:1Þ
NGC ¼ ½ðM1 À M2Þ=M2 Á 100
ð6:2Þ
Growth releases were then defined as those periods with at least five consecutive
years showing PGC values greater than 75%.
Basal area increment (BAI, cm
2 year
−1 ) is assumed to be a more meaningful
indicator of tree growth than tree-ring width because it removes variation in growth
attributable to increasing circumference. Therefore, ring widths were converted to
BAI assuming a circular outline of stem cross sections and using the formula:
BAI ¼ p R
2
t ÀR
2
tÀ1
À
Á
ð6:3Þ
where R is the radius of the tree and t is the year of tree-ring formation. In dominant
trees, BAI series usually show an early phase of low growth followed by a rapid
increase and a final stable phase. Mean annual values of tree-ring width, growth
change and BAI were obtained for declining and non-declining sites throughout the
twentieth century.
6.1.4 Climate-Growth Analyses
To assess the growth-climate relationships, a tree-ring width chronology was
established for each site (Table 6.1). For each tree, its ring-width series was double
detrended using a negative linear or exponential function and a cubic smoothing
spline with a 50% frequency response cutoff of 30 years to preserve high- and
medium-frequency variability. A spline flexible enough to maximise the tree-to-tree
shared growth variance and its response to climatic variability was selected following Macias et al. (2006). Autoregressive modelling was performed on each
detrended ring-width series, which were finally averaged using a biweight robust
mean to obtain residual site chronologies. All chronologies were built using the
program ARSTAN (Cook and Krusic 2005). All further climate-growth analyses
were performed using residual chronologies. The spatial and temporal relationships
among these site chronologies for the period 1900–1999 were summarised using
Principal Component Analysis (PCA).
I calculated 32 correlation functions relating each site chronology to the corresponding sub-regional climate dataset for the period 1950–1999. Climate-growth
relationships were calculated using monthly mean temperature and total precipitation from the previous January up to September of the growth year.
6 The Multiple Factors Explaining Decline in Mountain Forests …
139
1955. The percentage of positive (PGC) and negative (NGC) growth changes were
calculated in yearly increments as:
PGC ¼ M2 À M1
ð
Þ =M1
½
Á 100
ð6:1Þ
NGC ¼ ½ðM1 À M2Þ=M2 Á 100
ð6:2Þ
Growth releases were then defined as those periods with at least five consecutive
years showing PGC values greater than 75%.
Basal area increment (BAI, cm
2 year
−1 ) is assumed to be a more meaningful
indicator of tree growth than tree-ring width because it removes variation in growth
attributable to increasing circumference. Therefore, ring widths were converted to
BAI assuming a circular outline of stem cross sections and using the formula:
BAI ¼ p R
2
t ÀR
2
tÀ1
À
Á
ð6:3Þ
where R is the radius of the tree and t is the year of tree-ring formation. In dominant
trees, BAI series usually show an early phase of low growth followed by a rapid
increase and a final stable phase. Mean annual values of tree-ring width, growth
change and BAI were obtained for declining and non-declining sites throughout the
twentieth century.
6.1.4 Climate-Growth Analyses
To assess the growth-climate relationships, a tree-ring width chronology was
established for each site (Table 6.1). For each tree, its ring-width series was double
detrended using a negative linear or exponential function and a cubic smoothing
spline with a 50% frequency response cutoff of 30 years to preserve high- and
medium-frequency variability. A spline flexible enough to maximise the tree-to-tree
shared growth variance and its response to climatic variability was selected following Macias et al. (2006). Autoregressive modelling was performed on each
detrended ring-width series, which were finally averaged using a biweight robust
mean to obtain residual site chronologies. All chronologies were built using the
program ARSTAN (Cook and Krusic 2005). All further climate-growth analyses
were performed using residual chronologies. The spatial and temporal relationships
among these site chronologies for the period 1900–1999 were summarised using
Principal Component Analysis (PCA).
I calculated 32 correlation functions relating each site chronology to the corresponding sub-regional climate dataset for the period 1950–1999. Climate-growth
relationships were calculated using monthly mean temperature and total precipitation from the previous January up to September of the growth year.
6 The Multiple Factors Explaining Decline in Mountain Forests …
139