

138
R. Mattana et al.
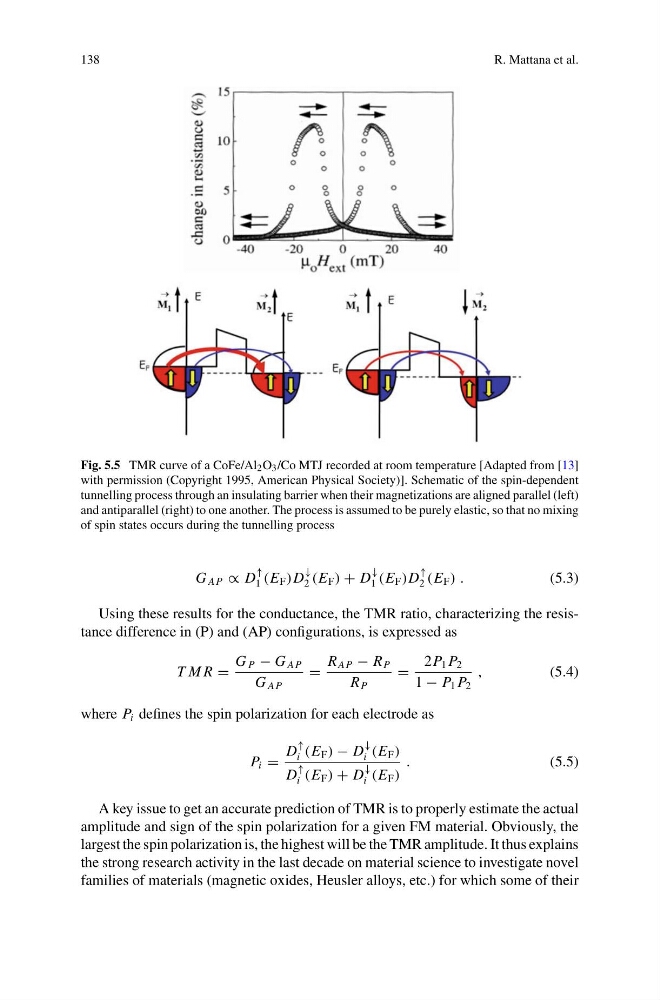
Fig. 5.5 TMR curve of a CoFe/Al 2 O 3 /Co MTJ recorded at room temperature [Adapted from [13]
with permission (Copyright 1995, American Physical Society)]. Schematic of the spin-dependent
tunnelling process through an insulating barrier when their magnetizations are aligned parallel (left)
and antiparallel (right) to one another. The process is assumed to be purely elastic, so that no mixing
of spin states occurs during the tunnelling process
G AP ∝ D
↑
1 (E F )D
↓
2 (E F ) + D
↓
1 (E F )D
↑
2 (E F ) .
(5.3)
Using these results for the conductance, the TMR ratio, characterizing the resistance difference in (P) and (AP) configurations, is expressed as
T M R =
G P − G AP
G AP
=
R AP − R P
R P
=
2P 1 P 2
1 − P 1 P 2
,
(5.4)
where P i defines the spin polarization for each electrode as
P i =
D
↑
i (E F ) − D
↓
i (E F )
D
↑
i (E F ) + D
↓
i (E F )
.
(5.5)
A key issue to get an accurate prediction of TMR is to properly estimate the actual
amplitude and sign of the spin polarization for a given FM material. Obviously, the
largest the spin polarization is, the highest will be the TMR amplitude. It thus explains
the strong research activity in the last decade on material science to investigate novel
families of materials (magnetic oxides, Heusler alloys, etc.) for which some of their
R. Mattana et al.
Fig. 5.5 TMR curve of a CoFe/Al 2 O 3 /Co MTJ recorded at room temperature [Adapted from [13]
with permission (Copyright 1995, American Physical Society)]. Schematic of the spin-dependent
tunnelling process through an insulating barrier when their magnetizations are aligned parallel (left)
and antiparallel (right) to one another. The process is assumed to be purely elastic, so that no mixing
of spin states occurs during the tunnelling process
G AP ∝ D
↑
1 (E F )D
↓
2 (E F ) + D
↓
1 (E F )D
↑
2 (E F ) .
(5.3)
Using these results for the conductance, the TMR ratio, characterizing the resistance difference in (P) and (AP) configurations, is expressed as
T M R =
G P − G AP
G AP
=
R AP − R P
R P
=
2P 1 P 2
1 − P 1 P 2
,
(5.4)
where P i defines the spin polarization for each electrode as
P i =
D
↑
i (E F ) − D
↓
i (E F )
D
↑
i (E F ) + D
↓
i (E F )
.
(5.5)
A key issue to get an accurate prediction of TMR is to properly estimate the actual
amplitude and sign of the spin polarization for a given FM material. Obviously, the
largest the spin polarization is, the highest will be the TMR amplitude. It thus explains
the strong research activity in the last decade on material science to investigate novel
families of materials (magnetic oxides, Heusler alloys, etc.) for which some of their