

55
the main pollen season. Even though the exact relationship between symptoms (pulmonary, nasal or ocular) and pollen occurrence and abundance is not yet clear, there
are some recent reports clarifying this interaction (e.g. Berger et al. 2013; Bastl
et al. 2014; Karatzas et al. 2014; Osborne et al. 2017; Voukantsis et al. 2015;
Damialis et al. 2019). Overall, there are indications that there is a positive correlation between allergic symptoms and pollen abundance. However, this relationship
can differ significantly among different bioclimatic regions, among different atopic
patients, and for each different pollen type, and of course the relationship itself is
not linear and there is usually a variable time lag between the actual pollen exposure
and the occurrence of the allergic symptoms. The above do make pollen season
forecasting (and consequent symptom forecasting) rather complex, thus highlighting the need for additional research in order to achieve accurate and operational
predictive models.
Knowing the exact pollen season (in terms of occurrence, magnitude and shape)
increases the capacity to accurately and in a timely way forecast the potential pollen
exposure significantly and constitutes the first-line tool for allergy prevention. As an
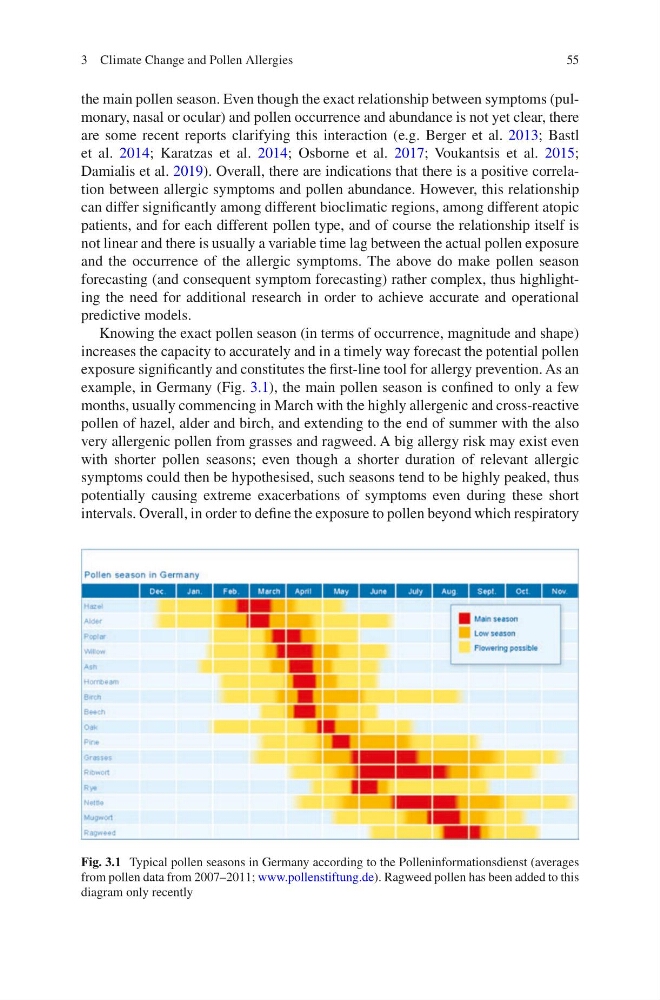
example, in Germany (Fig. 3.1), the main pollen season is confined to only a few
months, usually commencing in March with the highly allergenic and cross-reactive
pollen of hazel, alder and birch, and extending to the end of summer with the also
very allergenic pollen from grasses and ragweed. A big allergy risk may exist even
with shorter pollen seasons; even though a shorter duration of relevant allergic
symptoms could then be hypothesised, such seasons tend to be highly peaked, thus
potentially causing extreme exacerbations of symptoms even during these short
intervals. Overall, in order to define the exposure to pollen beyond which respiratory
Fig. 3.1 Typical pollen seasons in Germany according to the Polleninformationsdienst (averages
from pollen data from 2007–2011; www.pollenstiftung.de). Ragweed pollen has been added to this
diagram only recently
3 Climate Change and Pollen Allergies
the main pollen season. Even though the exact relationship between symptoms (pulmonary, nasal or ocular) and pollen occurrence and abundance is not yet clear, there
are some recent reports clarifying this interaction (e.g. Berger et al. 2013; Bastl
et al. 2014; Karatzas et al. 2014; Osborne et al. 2017; Voukantsis et al. 2015;
Damialis et al. 2019). Overall, there are indications that there is a positive correlation between allergic symptoms and pollen abundance. However, this relationship
can differ significantly among different bioclimatic regions, among different atopic
patients, and for each different pollen type, and of course the relationship itself is
not linear and there is usually a variable time lag between the actual pollen exposure
and the occurrence of the allergic symptoms. The above do make pollen season
forecasting (and consequent symptom forecasting) rather complex, thus highlighting the need for additional research in order to achieve accurate and operational
predictive models.
Knowing the exact pollen season (in terms of occurrence, magnitude and shape)
increases the capacity to accurately and in a timely way forecast the potential pollen
exposure significantly and constitutes the first-line tool for allergy prevention. As an
example, in Germany (Fig. 3.1), the main pollen season is confined to only a few
months, usually commencing in March with the highly allergenic and cross-reactive
pollen of hazel, alder and birch, and extending to the end of summer with the also
very allergenic pollen from grasses and ragweed. A big allergy risk may exist even
with shorter pollen seasons; even though a shorter duration of relevant allergic
symptoms could then be hypothesised, such seasons tend to be highly peaked, thus
potentially causing extreme exacerbations of symptoms even during these short
intervals. Overall, in order to define the exposure to pollen beyond which respiratory
Fig. 3.1 Typical pollen seasons in Germany according to the Polleninformationsdienst (averages
from pollen data from 2007–2011; www.pollenstiftung.de). Ragweed pollen has been added to this
diagram only recently
3 Climate Change and Pollen Allergies