

28
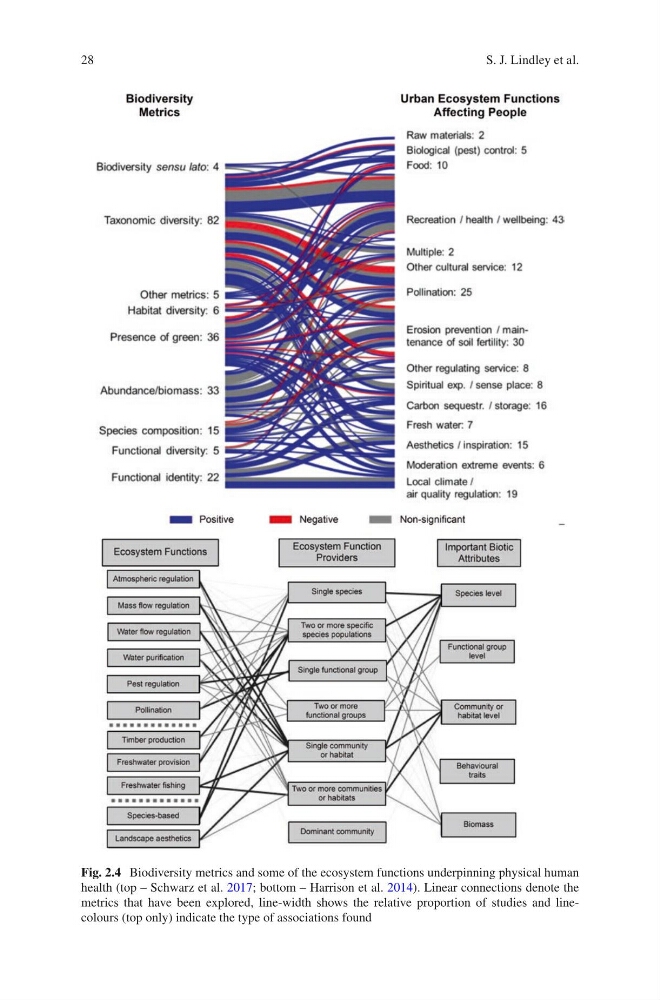
Fig. 2.4 Biodiversity metrics and some of the ecosystem functions underpinning physical human
health (top – Schwarz et al. 2017; bottom – Harrison et al. 2014). Linear connections denote the
metrics that have been explored, line-width shows the relative proportion of studies and linecolours (top only) indicate the type of associations found
S. J. Lindley et al.
Fig. 2.4 Biodiversity metrics and some of the ecosystem functions underpinning physical human
health (top – Schwarz et al. 2017; bottom – Harrison et al. 2014). Linear connections denote the
metrics that have been explored, line-width shows the relative proportion of studies and linecolours (top only) indicate the type of associations found
S. J. Lindley et al.