

444
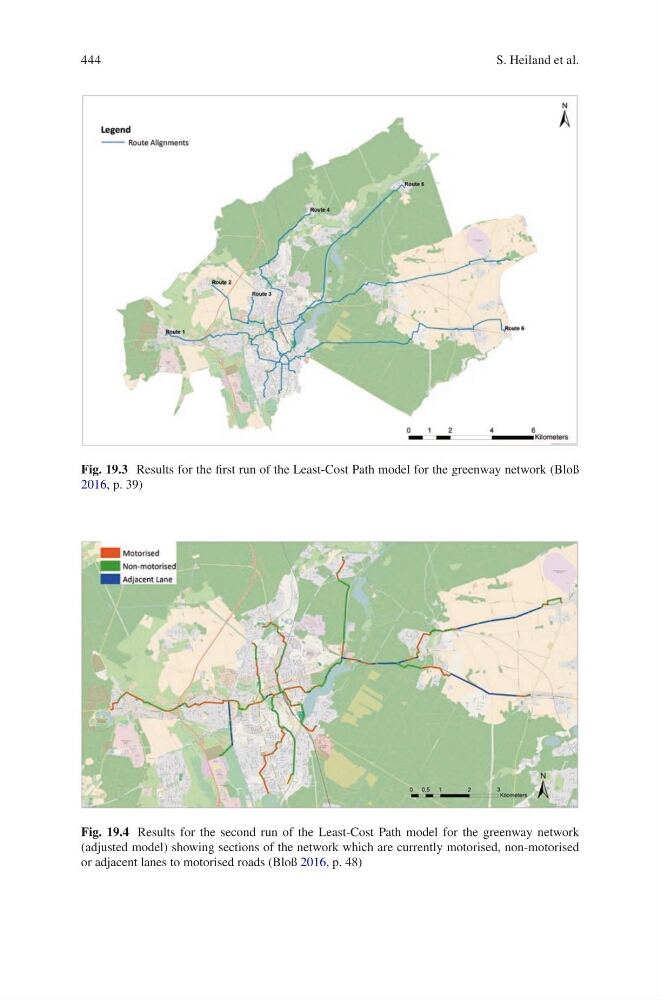
Fig. 19.3 Results for the first run of the Least-Cost Path model for the greenway network (Bloß
2016, p. 39)
Fig. 19.4 Results for the second run of the Least-Cost Path model for the greenway network
(adjusted model) showing sections of the network which are currently motorised, non-motorised
or adjacent lanes to motorised roads (Bloß 2016, p. 48)
S. Heiland et al.
Fig. 19.3 Results for the first run of the Least-Cost Path model for the greenway network (Bloß
2016, p. 39)
Fig. 19.4 Results for the second run of the Least-Cost Path model for the greenway network
(adjusted model) showing sections of the network which are currently motorised, non-motorised
or adjacent lanes to motorised roads (Bloß 2016, p. 48)
S. Heiland et al.