

64
L. Wugang et al.
correlations of sandstone fractures with Pearson product-moment correlation coefficient method were studied and showed that large rupture and small crack were
independent of each other in [5]. When the impulse method was applied to power
cable fault location, with the problem of the inaccuracy of fault time detection, the
authors proposed a signal correlation technique based on wavelet transform and
obtained the accurate arrival time of the pulses in Refs. [6–9] utilized the simulated
acoustic emission signals to located the damage source and found that it was feasible
to adopt the cross-correlation method to locate the AE source. Zhongwei et al. [10]
proposed a generalized cross-correlation method based on weighted functions with
a theoretical analysis of cross-correlation. From the articles above mentioned, correlation analysis method has been widely studied and used in theoretical and practical
realms.
It is crucial to obtain the effective AE signals for the post analysis such as failure
localization, damage evaluation and identification for damage modes when AE is
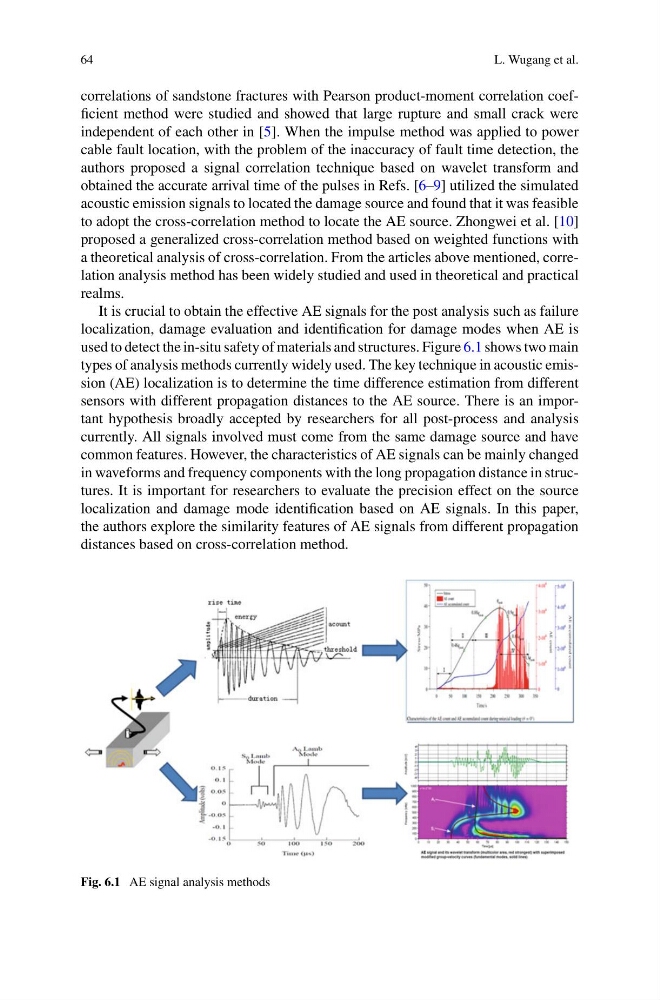
used to detect the in-situ safety of materials and structures. Figure 6.1 shows two main
types of analysis methods currently widely used. The key technique in acoustic emission (AE) localization is to determine the time difference estimation from different
sensors with different propagation distances to the AE source. There is an important hypothesis broadly accepted by researchers for all post-process and analysis
currently. All signals involved must come from the same damage source and have
common features. However, the characteristics of AE signals can be mainly changed
in waveforms and frequency components with the long propagation distance in structures. It is important for researchers to evaluate the precision effect on the source
localization and damage mode identification based on AE signals. In this paper,
the authors explore the similarity features of AE signals from different propagation
distances based on cross-correlation method.
Fig. 6.1 AE signal analysis methods
L. Wugang et al.
correlations of sandstone fractures with Pearson product-moment correlation coefficient method were studied and showed that large rupture and small crack were
independent of each other in [5]. When the impulse method was applied to power
cable fault location, with the problem of the inaccuracy of fault time detection, the
authors proposed a signal correlation technique based on wavelet transform and
obtained the accurate arrival time of the pulses in Refs. [6–9] utilized the simulated
acoustic emission signals to located the damage source and found that it was feasible
to adopt the cross-correlation method to locate the AE source. Zhongwei et al. [10]
proposed a generalized cross-correlation method based on weighted functions with
a theoretical analysis of cross-correlation. From the articles above mentioned, correlation analysis method has been widely studied and used in theoretical and practical
realms.
It is crucial to obtain the effective AE signals for the post analysis such as failure
localization, damage evaluation and identification for damage modes when AE is
used to detect the in-situ safety of materials and structures. Figure 6.1 shows two main
types of analysis methods currently widely used. The key technique in acoustic emission (AE) localization is to determine the time difference estimation from different
sensors with different propagation distances to the AE source. There is an important hypothesis broadly accepted by researchers for all post-process and analysis
currently. All signals involved must come from the same damage source and have
common features. However, the characteristics of AE signals can be mainly changed
in waveforms and frequency components with the long propagation distance in structures. It is important for researchers to evaluate the precision effect on the source
localization and damage mode identification based on AE signals. In this paper,
the authors explore the similarity features of AE signals from different propagation
distances based on cross-correlation method.
Fig. 6.1 AE signal analysis methods