

49 A Comparison of Acoustic Emission in Cadaveric Specimens …
557
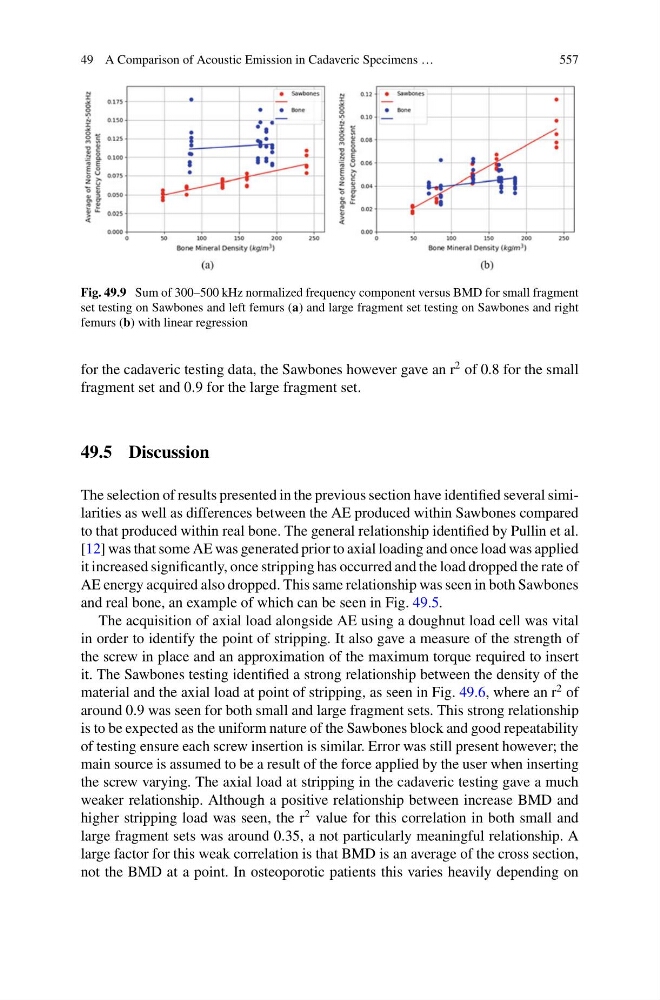
Fig. 49.9 Sum of 300–500 kHz normalized frequency component versus BMD for small fragment
set testing on Sawbones and left femurs (a) and large fragment set testing on Sawbones and right
femurs (b) with linear regression
for the cadaveric testing data, the Sawbones however gave an r
2 of 0.8 for the small
fragment set and 0.9 for the large fragment set.
49.5 Discussion
The selection of results presented in the previous section have identified several similarities as well as differences between the AE produced within Sawbones compared
to that produced within real bone. The general relationship identified by Pullin et al.
[12] was that some AE was generated prior to axial loading and once load was applied
it increased significantly, once stripping has occurred and the load dropped the rate of
AE energy acquired also dropped. This same relationship was seen in both Sawbones
and real bone, an example of which can be seen in Fig. 49.5.
The acquisition of axial load alongside AE using a doughnut load cell was vital
in order to identify the point of stripping. It also gave a measure of the strength of
the screw in place and an approximation of the maximum torque required to insert
it. The Sawbones testing identified a strong relationship between the density of the
material and the axial load at point of stripping, as seen in Fig. 49.6, where an r
2 of
around 0.9 was seen for both small and large fragment sets. This strong relationship
is to be expected as the uniform nature of the Sawbones block and good repeatability
of testing ensure each screw insertion is similar. Error was still present however; the
main source is assumed to be a result of the force applied by the user when inserting
the screw varying. The axial load at stripping in the cadaveric testing gave a much
weaker relationship. Although a positive relationship between increase BMD and
higher stripping load was seen, the r
2 value for this correlation in both small and
large fragment sets was around 0.35, a not particularly meaningful relationship. A
large factor for this weak correlation is that BMD is an average of the cross section,
not the BMD at a point. In osteoporotic patients this varies heavily depending on
557
Fig. 49.9 Sum of 300–500 kHz normalized frequency component versus BMD for small fragment
set testing on Sawbones and left femurs (a) and large fragment set testing on Sawbones and right
femurs (b) with linear regression
for the cadaveric testing data, the Sawbones however gave an r
2 of 0.8 for the small
fragment set and 0.9 for the large fragment set.
49.5 Discussion
The selection of results presented in the previous section have identified several similarities as well as differences between the AE produced within Sawbones compared
to that produced within real bone. The general relationship identified by Pullin et al.
[12] was that some AE was generated prior to axial loading and once load was applied
it increased significantly, once stripping has occurred and the load dropped the rate of
AE energy acquired also dropped. This same relationship was seen in both Sawbones
and real bone, an example of which can be seen in Fig. 49.5.
The acquisition of axial load alongside AE using a doughnut load cell was vital
in order to identify the point of stripping. It also gave a measure of the strength of
the screw in place and an approximation of the maximum torque required to insert
it. The Sawbones testing identified a strong relationship between the density of the
material and the axial load at point of stripping, as seen in Fig. 49.6, where an r
2 of
around 0.9 was seen for both small and large fragment sets. This strong relationship
is to be expected as the uniform nature of the Sawbones block and good repeatability
of testing ensure each screw insertion is similar. Error was still present however; the
main source is assumed to be a result of the force applied by the user when inserting
the screw varying. The axial load at stripping in the cadaveric testing gave a much
weaker relationship. Although a positive relationship between increase BMD and
higher stripping load was seen, the r
2 value for this correlation in both small and
large fragment sets was around 0.35, a not particularly meaningful relationship. A
large factor for this weak correlation is that BMD is an average of the cross section,
not the BMD at a point. In osteoporotic patients this varies heavily depending on