

49 A Comparison of Acoustic Emission in Cadaveric Specimens …
555
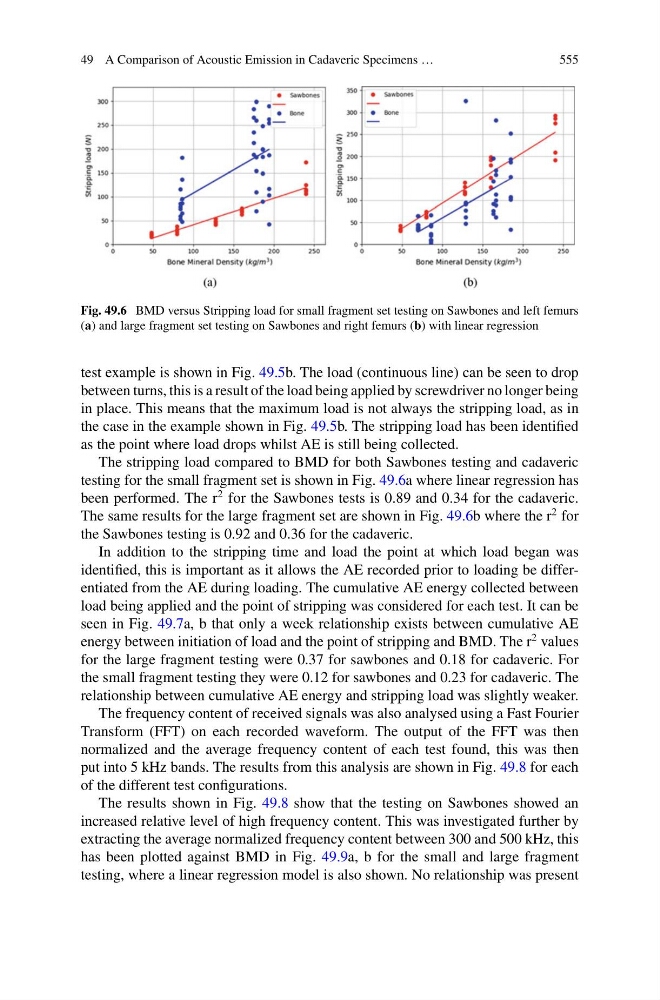
Fig. 49.6 BMD versus Stripping load for small fragment set testing on Sawbones and left femurs
(a) and large fragment set testing on Sawbones and right femurs (b) with linear regression
test example is shown in Fig. 49.5b. The load (continuous line) can be seen to drop
between turns, this is a result of the load being applied by screwdriver no longer being
in place. This means that the maximum load is not always the stripping load, as in
the case in the example shown in Fig. 49.5b. The stripping load has been identified
as the point where load drops whilst AE is still being collected.
The stripping load compared to BMD for both Sawbones testing and cadaveric
testing for the small fragment set is shown in Fig. 49.6a where linear regression has
been performed. The r
2 for the Sawbones tests is 0.89 and 0.34 for the cadaveric.
The same results for the large fragment set are shown in Fig. 49.6b where the r
2 for
the Sawbones testing is 0.92 and 0.36 for the cadaveric.
In addition to the stripping time and load the point at which load began was
identified, this is important as it allows the AE recorded prior to loading be differentiated from the AE during loading. The cumulative AE energy collected between
load being applied and the point of stripping was considered for each test. It can be
seen in Fig. 49.7a, b that only a week relationship exists between cumulative AE
energy between initiation of load and the point of stripping and BMD. The r
2 values
for the large fragment testing were 0.37 for sawbones and 0.18 for cadaveric. For
the small fragment testing they were 0.12 for sawbones and 0.23 for cadaveric. The
relationship between cumulative AE energy and stripping load was slightly weaker.
The frequency content of received signals was also analysed using a Fast Fourier
Transform (FFT) on each recorded waveform. The output of the FFT was then
normalized and the average frequency content of each test found, this was then
put into 5 kHz bands. The results from this analysis are shown in Fig. 49.8 for each
of the different test configurations.
The results shown in Fig. 49.8 show that the testing on Sawbones showed an
increased relative level of high frequency content. This was investigated further by
extracting the average normalized frequency content between 300 and 500 kHz, this
has been plotted against BMD in Fig. 49.9a, b for the small and large fragment
testing, where a linear regression model is also shown. No relationship was present
555
Fig. 49.6 BMD versus Stripping load for small fragment set testing on Sawbones and left femurs
(a) and large fragment set testing on Sawbones and right femurs (b) with linear regression
test example is shown in Fig. 49.5b. The load (continuous line) can be seen to drop
between turns, this is a result of the load being applied by screwdriver no longer being
in place. This means that the maximum load is not always the stripping load, as in
the case in the example shown in Fig. 49.5b. The stripping load has been identified
as the point where load drops whilst AE is still being collected.
The stripping load compared to BMD for both Sawbones testing and cadaveric
testing for the small fragment set is shown in Fig. 49.6a where linear regression has
been performed. The r
2 for the Sawbones tests is 0.89 and 0.34 for the cadaveric.
The same results for the large fragment set are shown in Fig. 49.6b where the r
2 for
the Sawbones testing is 0.92 and 0.36 for the cadaveric.
In addition to the stripping time and load the point at which load began was
identified, this is important as it allows the AE recorded prior to loading be differentiated from the AE during loading. The cumulative AE energy collected between
load being applied and the point of stripping was considered for each test. It can be
seen in Fig. 49.7a, b that only a week relationship exists between cumulative AE
energy between initiation of load and the point of stripping and BMD. The r
2 values
for the large fragment testing were 0.37 for sawbones and 0.18 for cadaveric. For
the small fragment testing they were 0.12 for sawbones and 0.23 for cadaveric. The
relationship between cumulative AE energy and stripping load was slightly weaker.
The frequency content of received signals was also analysed using a Fast Fourier
Transform (FFT) on each recorded waveform. The output of the FFT was then
normalized and the average frequency content of each test found, this was then
put into 5 kHz bands. The results from this analysis are shown in Fig. 49.8 for each
of the different test configurations.
The results shown in Fig. 49.8 show that the testing on Sawbones showed an
increased relative level of high frequency content. This was investigated further by
extracting the average normalized frequency content between 300 and 500 kHz, this
has been plotted against BMD in Fig. 49.9a, b for the small and large fragment
testing, where a linear regression model is also shown. No relationship was present