

2 Internet of Things Acoustic Emission: Systems and Applications
29
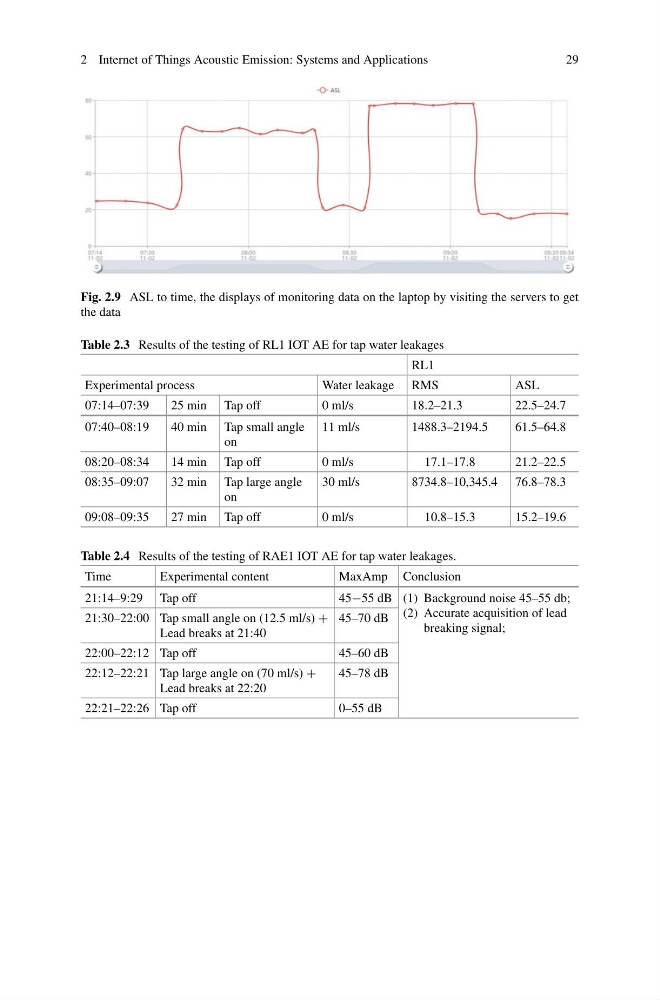
Fig. 2.9 ASL to time, the displays of monitoring data on the laptop by visiting the servers to get
the data
Table 2.3 Results of the testing of RL1 IOT AE for tap water leakages
RL1
Experimental process
Water leakage RMS
ASL
07:14–07:39
25 min Tap off
0 ml/s
18.2–21.3
22.5–24.7
07:40–08:19
40 min Tap small angle
on
11 ml/s
1488.3–2194.5
61.5–64.8
08:20–08:34
14 min Tap off
0 ml/s
17.1–17.8
21.2–22.5
08:35–09:07
32 min Tap large angle
on
30 ml/s
8734.8–10,345.4 76.8–78.3
09:08–09:35
27 min Tap off
0 ml/s
10.8–15.3
15.2–19.6
Table 2.4 Results of the testing of RAE1 IOT AE for tap water leakages.
Time
Experimental content
MaxAmp Conclusion
21:14–9:29 Tap off
45−55 dB (1) Background noise 45–55 db;
(2) Accurate acquisition of lead
breaking signal;
21:30–22:00 Tap small angle on (12.5 ml/s) +
Lead breaks at 21:40
45–70 dB
22:00–22:12 Tap off
45–60 dB
22:12–22:21 Tap large angle on (70 ml/s) +
Lead breaks at 22:20
45–78 dB
22:21–22:26 Tap off
0–55 dB
29
Fig. 2.9 ASL to time, the displays of monitoring data on the laptop by visiting the servers to get
the data
Table 2.3 Results of the testing of RL1 IOT AE for tap water leakages
RL1
Experimental process
Water leakage RMS
ASL
07:14–07:39
25 min Tap off
0 ml/s
18.2–21.3
22.5–24.7
07:40–08:19
40 min Tap small angle
on
11 ml/s
1488.3–2194.5
61.5–64.8
08:20–08:34
14 min Tap off
0 ml/s
17.1–17.8
21.2–22.5
08:35–09:07
32 min Tap large angle
on
30 ml/s
8734.8–10,345.4 76.8–78.3
09:08–09:35
27 min Tap off
0 ml/s
10.8–15.3
15.2–19.6
Table 2.4 Results of the testing of RAE1 IOT AE for tap water leakages.
Time
Experimental content
MaxAmp Conclusion
21:14–9:29 Tap off
45−55 dB (1) Background noise 45–55 db;
(2) Accurate acquisition of lead
breaking signal;
21:30–22:00 Tap small angle on (12.5 ml/s) +
Lead breaks at 21:40
45–70 dB
22:00–22:12 Tap off
45–60 dB
22:12–22:21 Tap large angle on (70 ml/s) +
Lead breaks at 22:20
45–78 dB
22:21–22:26 Tap off
0–55 dB