

24
J. Xie et al.
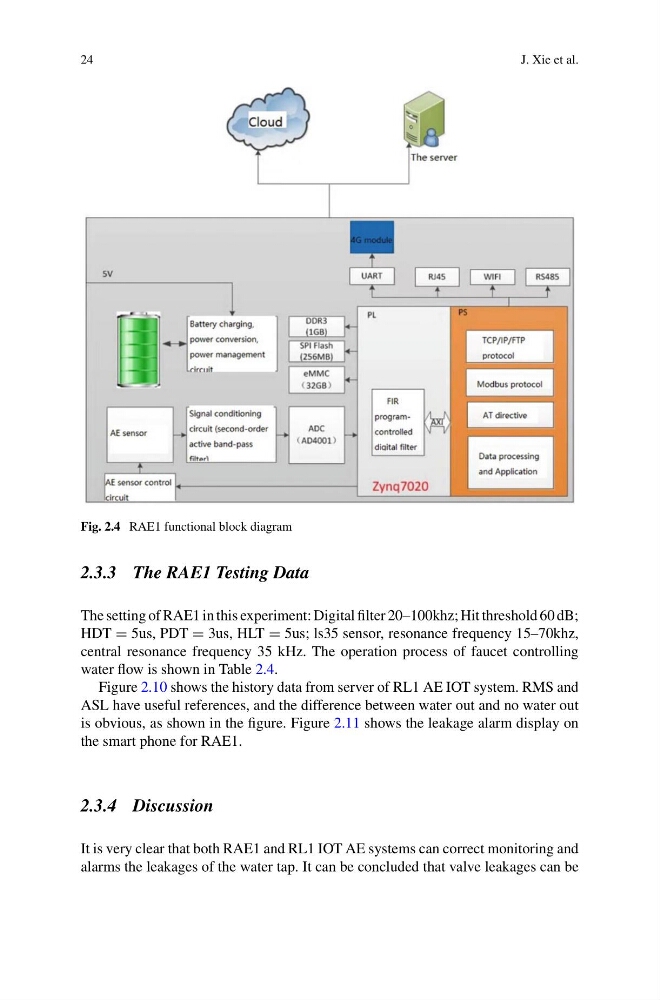
Fig. 2.4 RAE1 functional block diagram
2.3.3 The RAE1 Testing Data
The setting of RAE1 in this experiment: Digital filter 20–100khz; Hit threshold 60 dB;
HDT = 5us, PDT = 3us, HLT = 5us; ls35 sensor, resonance frequency 15–70khz,
central resonance frequency 35 kHz. The operation process of faucet controlling
water flow is shown in Table 2.4.
Figure 2.10 shows the history data from server of RL1 AE IOT system. RMS and
ASL have useful references, and the difference between water out and no water out
is obvious, as shown in the figure. Figure 2.11 shows the leakage alarm display on
the smart phone for RAE1.
2.3.4 Discussion
It is very clear that both RAE1 and RL1 IOT AE systems can correct monitoring and
alarms the leakages of the water tap. It can be concluded that valve leakages can be
J. Xie et al.
Fig. 2.4 RAE1 functional block diagram
2.3.3 The RAE1 Testing Data
The setting of RAE1 in this experiment: Digital filter 20–100khz; Hit threshold 60 dB;
HDT = 5us, PDT = 3us, HLT = 5us; ls35 sensor, resonance frequency 15–70khz,
central resonance frequency 35 kHz. The operation process of faucet controlling
water flow is shown in Table 2.4.
Figure 2.10 shows the history data from server of RL1 AE IOT system. RMS and
ASL have useful references, and the difference between water out and no water out
is obvious, as shown in the figure. Figure 2.11 shows the leakage alarm display on
the smart phone for RAE1.
2.3.4 Discussion
It is very clear that both RAE1 and RL1 IOT AE systems can correct monitoring and
alarms the leakages of the water tap. It can be concluded that valve leakages can be