

40 Localization of Acoustic Emission Sources …
461
The location maps of AE sources at the two different acoustic velocities V u in
Fig. 40.8 is analyzed respectively. When the deviation between the sound velocity
value entered in the location software (V u ) and the actual velocity is too large
(Fig. 40.8b), the deviation of the location source and the physical source is large
as well, meanwhile, the location tends to be close to the middle of the sensors array,
what’ worse, even the effective locations can’t be achieved in some areas (such as the
positions sensors 7
# and 8
# placed). The multiple locations where the sensors 10
# and
11
# arranged are not concentrated and fails to achieve effective locations,which is
caused by the irregular geometry of the region: in the small triangular area composed
of the apexes of the crescent rib and the intersecting curves of the main cone and the
branch cone(that is the intersection area of area A1 andA2), the surfaces is complicated with large local curvature, in addition, the inner edge and external edge of the
rib protruding from the shell plate may cause the change of the acoustic propagation
paths and great change of the acoustic velocity after the wave transmitting through
the weld or rib, therefore the location precision of AE sources will be lower.
Channel 3
# is selected as the transmit of AE signals, and the planar location array
is composed of sensors 1
# , 2
# , 3
# and 4
# .
The location of AE signals generated successively by the same AE source is not
a point, but a location group around the physical position of the source. Therefore,
cluster analysis is used to take the center of the location group in the rectangular
cluster as the position of the physical source, and the size of the rectangular cluster
is 300 × 300 (mm). The coordinate of the physical source is (1700, −260), and the
maximum sensor spacing of the location group is 3000 mm.
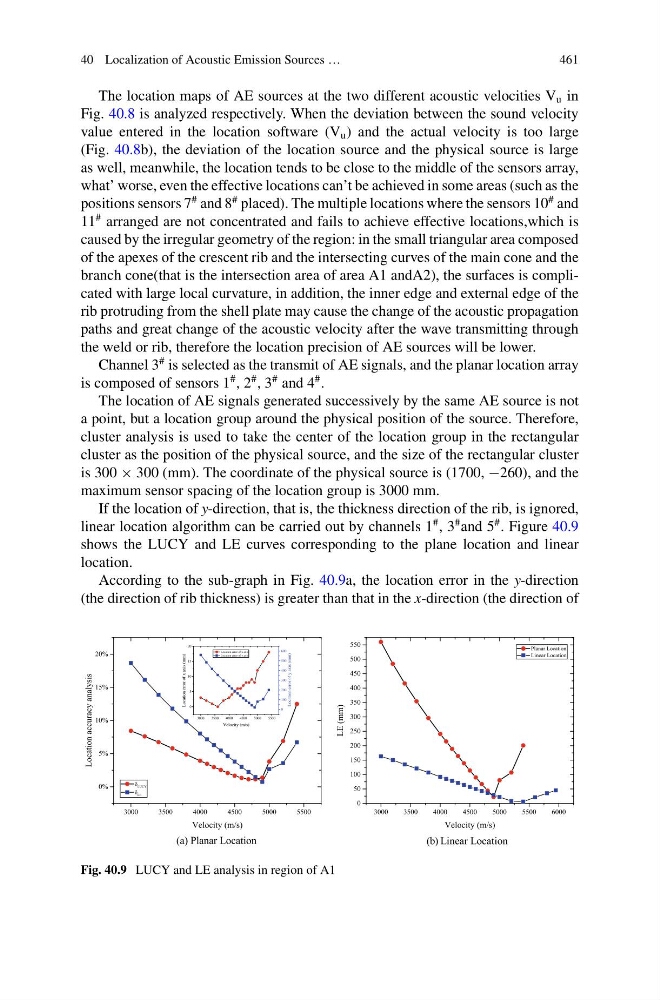
If the location of y-direction, that is, the thickness direction of the rib, is ignored,
linear location algorithm can be carried out by channels 1
# , 3
# and 5
# . Figure 40.9
shows the LUCY and LE curves corresponding to the plane location and linear
location.
According to the sub-graph in Fig. 40.9a, the location error in the y-direction
(the direction of rib thickness) is greater than that in the x-direction (the direction of
Fig. 40.9 LUCY and LE analysis in region of A1
461
The location maps of AE sources at the two different acoustic velocities V u in
Fig. 40.8 is analyzed respectively. When the deviation between the sound velocity
value entered in the location software (V u ) and the actual velocity is too large
(Fig. 40.8b), the deviation of the location source and the physical source is large
as well, meanwhile, the location tends to be close to the middle of the sensors array,
what’ worse, even the effective locations can’t be achieved in some areas (such as the
positions sensors 7
# and 8
# placed). The multiple locations where the sensors 10
# and
11
# arranged are not concentrated and fails to achieve effective locations,which is
caused by the irregular geometry of the region: in the small triangular area composed
of the apexes of the crescent rib and the intersecting curves of the main cone and the
branch cone(that is the intersection area of area A1 andA2), the surfaces is complicated with large local curvature, in addition, the inner edge and external edge of the
rib protruding from the shell plate may cause the change of the acoustic propagation
paths and great change of the acoustic velocity after the wave transmitting through
the weld or rib, therefore the location precision of AE sources will be lower.
Channel 3
# is selected as the transmit of AE signals, and the planar location array
is composed of sensors 1
# , 2
# , 3
# and 4
# .
The location of AE signals generated successively by the same AE source is not
a point, but a location group around the physical position of the source. Therefore,
cluster analysis is used to take the center of the location group in the rectangular
cluster as the position of the physical source, and the size of the rectangular cluster
is 300 × 300 (mm). The coordinate of the physical source is (1700, −260), and the
maximum sensor spacing of the location group is 3000 mm.
If the location of y-direction, that is, the thickness direction of the rib, is ignored,
linear location algorithm can be carried out by channels 1
# , 3
# and 5
# . Figure 40.9
shows the LUCY and LE curves corresponding to the plane location and linear
location.
According to the sub-graph in Fig. 40.9a, the location error in the y-direction
(the direction of rib thickness) is greater than that in the x-direction (the direction of
Fig. 40.9 LUCY and LE analysis in region of A1