

322
Y. Yang et al.
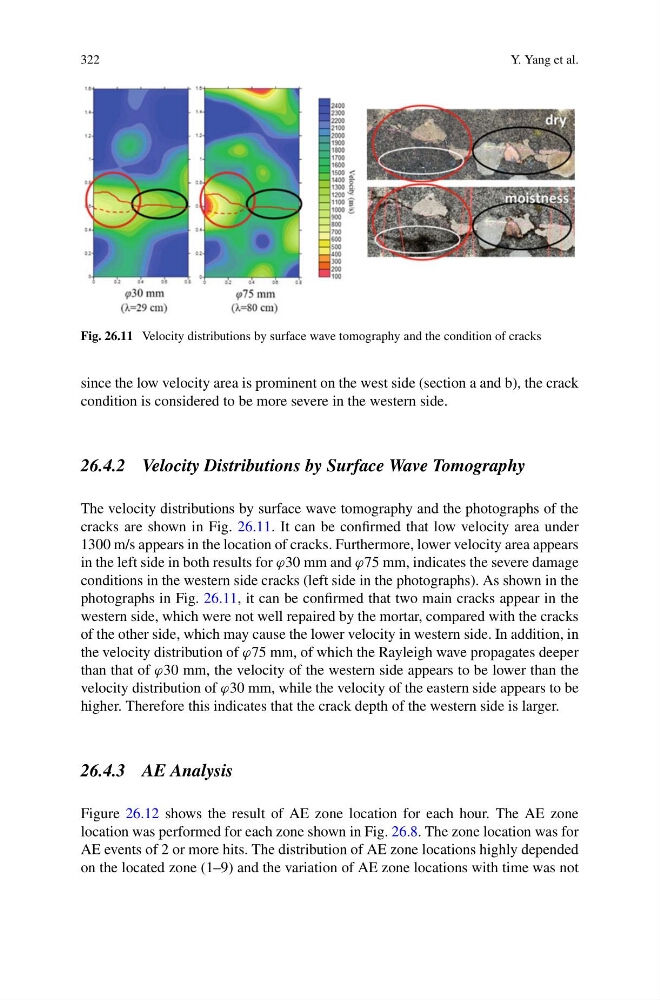
Fig. 26.11 Velocity distributions by surface wave tomography and the condition of cracks
since the low velocity area is prominent on the west side (section a and b), the crack
condition is considered to be more severe in the western side.
26.4.2 Velocity Distributions by Surface Wave Tomography
The velocity distributions by surface wave tomography and the photographs of the
cracks are shown in Fig. 26.11. It can be confirmed that low velocity area under
1300 m/s appears in the location of cracks. Furthermore, lower velocity area appears
in the left side in both results for ϕ30 mm and ϕ75 mm, indicates the severe damage
conditions in the western side cracks (left side in the photographs). As shown in the
photographs in Fig. 26.11, it can be confirmed that two main cracks appear in the
western side, which were not well repaired by the mortar, compared with the cracks
of the other side, which may cause the lower velocity in western side. In addition, in
the velocity distribution of ϕ75 mm, of which the Rayleigh wave propagates deeper
than that of ϕ30 mm, the velocity of the western side appears to be lower than the
velocity distribution of ϕ30 mm, while the velocity of the eastern side appears to be
higher. Therefore this indicates that the crack depth of the western side is larger.
26.4.3 AE Analysis
Figure 26.12 shows the result of AE zone location for each hour. The AE zone
location was performed for each zone shown in Fig. 26.8. The zone location was for
AE events of 2 or more hits. The distribution of AE zone locations highly depended
on the located zone (1–9) and the variation of AE zone locations with time was not
Y. Yang et al.
Fig. 26.11 Velocity distributions by surface wave tomography and the condition of cracks
since the low velocity area is prominent on the west side (section a and b), the crack
condition is considered to be more severe in the western side.
26.4.2 Velocity Distributions by Surface Wave Tomography
The velocity distributions by surface wave tomography and the photographs of the
cracks are shown in Fig. 26.11. It can be confirmed that low velocity area under
1300 m/s appears in the location of cracks. Furthermore, lower velocity area appears
in the left side in both results for ϕ30 mm and ϕ75 mm, indicates the severe damage
conditions in the western side cracks (left side in the photographs). As shown in the
photographs in Fig. 26.11, it can be confirmed that two main cracks appear in the
western side, which were not well repaired by the mortar, compared with the cracks
of the other side, which may cause the lower velocity in western side. In addition, in
the velocity distribution of ϕ75 mm, of which the Rayleigh wave propagates deeper
than that of ϕ30 mm, the velocity of the western side appears to be lower than the
velocity distribution of ϕ30 mm, while the velocity of the eastern side appears to be
higher. Therefore this indicates that the crack depth of the western side is larger.
26.4.3 AE Analysis
Figure 26.12 shows the result of AE zone location for each hour. The AE zone
location was performed for each zone shown in Fig. 26.8. The zone location was for
AE events of 2 or more hits. The distribution of AE zone locations highly depended
on the located zone (1–9) and the variation of AE zone locations with time was not