

8
L. Dong
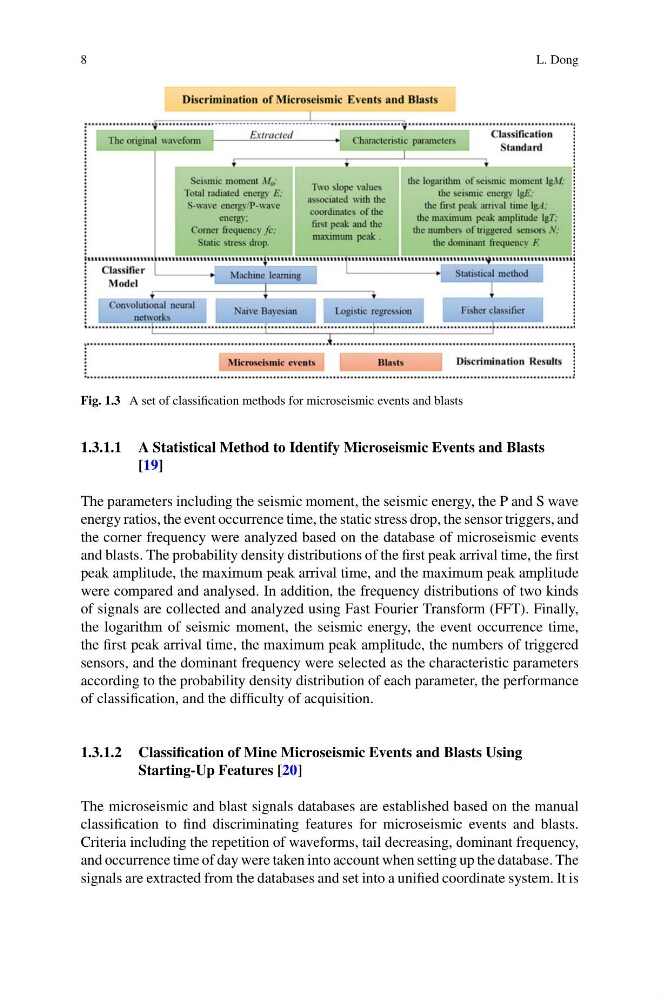
Fig. 1.3 A set of classification methods for microseismic events and blasts
1.3.1.1 A Statistical Method to Identify Microseismic Events and Blasts
[19]
The parameters including the seismic moment, the seismic energy, the P and S wave
energy ratios, the event occurrence time, the static stress drop, the sensor triggers, and
the corner frequency were analyzed based on the database of microseismic events
and blasts. The probability density distributions of the first peak arrival time, the first
peak amplitude, the maximum peak arrival time, and the maximum peak amplitude
were compared and analysed. In addition, the frequency distributions of two kinds
of signals are collected and analyzed using Fast Fourier Transform (FFT). Finally,
the logarithm of seismic moment, the seismic energy, the event occurrence time,
the first peak arrival time, the maximum peak amplitude, the numbers of triggered
sensors, and the dominant frequency were selected as the characteristic parameters
according to the probability density distribution of each parameter, the performance
of classification, and the difficulty of acquisition.
1.3.1.2 Classification of Mine Microseismic Events and Blasts Using
Starting-Up Features [20]
The microseismic and blast signals databases are established based on the manual
classification to find discriminating features for microseismic events and blasts.
Criteria including the repetition of waveforms, tail decreasing, dominant frequency,
and occurrence time of day were taken into account when setting up the database. The
signals are extracted from the databases and set into a unified coordinate system. It is
L. Dong
Fig. 1.3 A set of classification methods for microseismic events and blasts
1.3.1.1 A Statistical Method to Identify Microseismic Events and Blasts
[19]
The parameters including the seismic moment, the seismic energy, the P and S wave
energy ratios, the event occurrence time, the static stress drop, the sensor triggers, and
the corner frequency were analyzed based on the database of microseismic events
and blasts. The probability density distributions of the first peak arrival time, the first
peak amplitude, the maximum peak arrival time, and the maximum peak amplitude
were compared and analysed. In addition, the frequency distributions of two kinds
of signals are collected and analyzed using Fast Fourier Transform (FFT). Finally,
the logarithm of seismic moment, the seismic energy, the event occurrence time,
the first peak arrival time, the maximum peak amplitude, the numbers of triggered
sensors, and the dominant frequency were selected as the characteristic parameters
according to the probability density distribution of each parameter, the performance
of classification, and the difficulty of acquisition.
1.3.1.2 Classification of Mine Microseismic Events and Blasts Using
Starting-Up Features [20]
The microseismic and blast signals databases are established based on the manual
classification to find discriminating features for microseismic events and blasts.
Criteria including the repetition of waveforms, tail decreasing, dominant frequency,
and occurrence time of day were taken into account when setting up the database. The
signals are extracted from the databases and set into a unified coordinate system. It is