

290
Y. Yuan et al.
Table 24.7 The main distribution range of acoustic emission signal parameters
(a) Sample without pre-defects (A)
Hits
Amplitude (dB) Energy (eu)
Duration time
(µs)
Duration time
(µs)
Counts
181
35–78
1−9E4
1–2000
1–500
1–40
(b) Preset round notch sample (B)
6
36.1;36.5;37.5;
37.3;72.7;40.7
4.56;4.78;4.38;
5.35;9.4E3;20.6
3.8;3.4;4.2;
4.8;472.3;50.8
0.3;0.6;3.5;
0.8;254.3;24.4
1;1;1;
1;46;5
(c) Preset V-shaped notch sample (C)
6
45.6;48.2;35.5;
100;45.8;48.5
65.9;149;3.49;
7.57E6;27.2;107
107.7;134.1;0.5;
1808.4;32;165
42.5;33.7;0.2;
33.1;19.5;33.2
13;21;1;
215;4;17
a sample without pre-defect, and the energy value of a sample with preset V-shaped
notch is greater than the energy value of a sample without pre-defect. Therefore, the
hits and amplitude value are analyzed as characteristic parameters.
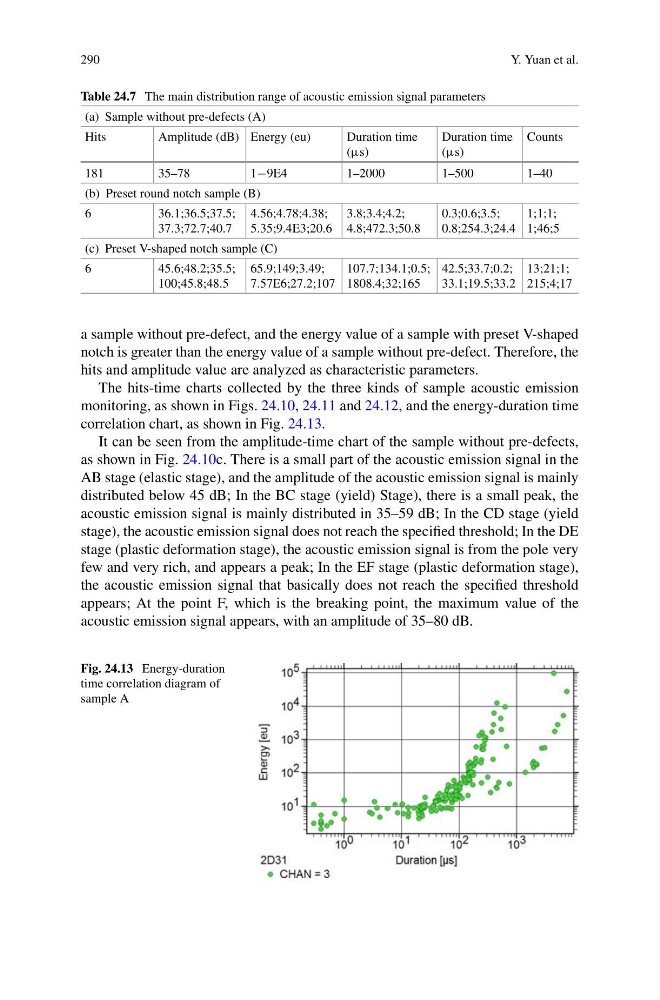
The hits-time charts collected by the three kinds of sample acoustic emission
monitoring, as shown in Figs. 24.10, 24.11 and 24.12, and the energy-duration time
correlation chart, as shown in Fig. 24.13.
It can be seen from the amplitude-time chart of the sample without pre-defects,
as shown in Fig. 24.10c. There is a small part of the acoustic emission signal in the
AB stage (elastic stage), and the amplitude of the acoustic emission signal is mainly
distributed below 45 dB; In the BC stage (yield) Stage), there is a small peak, the
acoustic emission signal is mainly distributed in 35–59 dB; In the CD stage (yield
stage), the acoustic emission signal does not reach the specified threshold; In the DE
stage (plastic deformation stage), the acoustic emission signal is from the pole very
few and very rich, and appears a peak; In the EF stage (plastic deformation stage),
the acoustic emission signal that basically does not reach the specified threshold
appears; At the point F, which is the breaking point, the maximum value of the
acoustic emission signal appears, with an amplitude of 35–80 dB.
Fig. 24.13 Energy-duration
time correlation diagram of
sample A
Y. Yuan et al.
Table 24.7 The main distribution range of acoustic emission signal parameters
(a) Sample without pre-defects (A)
Hits
Amplitude (dB) Energy (eu)
Duration time
(µs)
Duration time
(µs)
Counts
181
35–78
1−9E4
1–2000
1–500
1–40
(b) Preset round notch sample (B)
6
36.1;36.5;37.5;
37.3;72.7;40.7
4.56;4.78;4.38;
5.35;9.4E3;20.6
3.8;3.4;4.2;
4.8;472.3;50.8
0.3;0.6;3.5;
0.8;254.3;24.4
1;1;1;
1;46;5
(c) Preset V-shaped notch sample (C)
6
45.6;48.2;35.5;
100;45.8;48.5
65.9;149;3.49;
7.57E6;27.2;107
107.7;134.1;0.5;
1808.4;32;165
42.5;33.7;0.2;
33.1;19.5;33.2
13;21;1;
215;4;17
a sample without pre-defect, and the energy value of a sample with preset V-shaped
notch is greater than the energy value of a sample without pre-defect. Therefore, the
hits and amplitude value are analyzed as characteristic parameters.
The hits-time charts collected by the three kinds of sample acoustic emission
monitoring, as shown in Figs. 24.10, 24.11 and 24.12, and the energy-duration time
correlation chart, as shown in Fig. 24.13.
It can be seen from the amplitude-time chart of the sample without pre-defects,
as shown in Fig. 24.10c. There is a small part of the acoustic emission signal in the
AB stage (elastic stage), and the amplitude of the acoustic emission signal is mainly
distributed below 45 dB; In the BC stage (yield) Stage), there is a small peak, the
acoustic emission signal is mainly distributed in 35–59 dB; In the CD stage (yield
stage), the acoustic emission signal does not reach the specified threshold; In the DE
stage (plastic deformation stage), the acoustic emission signal is from the pole very
few and very rich, and appears a peak; In the EF stage (plastic deformation stage),
the acoustic emission signal that basically does not reach the specified threshold
appears; At the point F, which is the breaking point, the maximum value of the
acoustic emission signal appears, with an amplitude of 35–80 dB.
Fig. 24.13 Energy-duration
time correlation diagram of
sample A