

288
Y. Yuan et al.
Table 24.4 The frequency distribution of the A sample (kHz)
Stage
VS150-M VS45-H VS900-M
Stage AB (elastic stage)
70–170
90–120 90–180
Stage BC (ascending stage of yield stage)
100–170
80–170 90–180
Stage DE (first half of plastic deformation stage)
130–260
90–180 120–170
Stage EF (the second half of the plastic deformation stage)
90–180
90–180 /
Point F (when pulled off)
80–250
90–140 80–160
a)Hits-time
b)Energy-time
c) Amplitude-time
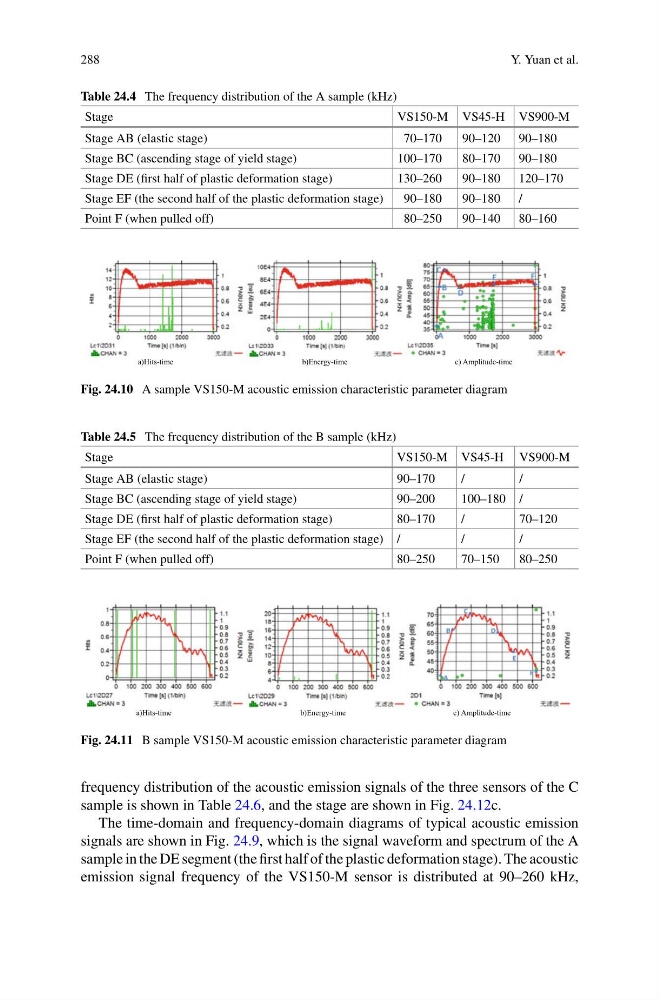
Fig. 24.10 A sample VS150-M acoustic emission characteristic parameter diagram
Table 24.5 The frequency distribution of the B sample (kHz)
Stage
VS150-M VS45-H VS900-M
Stage AB (elastic stage)
90–170
/
/
Stage BC (ascending stage of yield stage)
90–200
100–180 /
Stage DE (first half of plastic deformation stage)
80–170
/
70–120
Stage EF (the second half of the plastic deformation stage) /
/
/
Point F (when pulled off)
80–250
70–150
80–250
a)Hits-time
b)Energy-time
c) Amplitude-time
Fig. 24.11 B sample VS150-M acoustic emission characteristic parameter diagram
frequency distribution of the acoustic emission signals of the three sensors of the C
sample is shown in Table 24.6, and the stage are shown in Fig. 24.12c.
The time-domain and frequency-domain diagrams of typical acoustic emission
signals are shown in Fig. 24.9, which is the signal waveform and spectrum of the A
sample in the DE segment (the first half of the plastic deformation stage). The acoustic
emission signal frequency of the VS150-M sensor is distributed at 90–260 kHz,
Y. Yuan et al.
Table 24.4 The frequency distribution of the A sample (kHz)
Stage
VS150-M VS45-H VS900-M
Stage AB (elastic stage)
70–170
90–120 90–180
Stage BC (ascending stage of yield stage)
100–170
80–170 90–180
Stage DE (first half of plastic deformation stage)
130–260
90–180 120–170
Stage EF (the second half of the plastic deformation stage)
90–180
90–180 /
Point F (when pulled off)
80–250
90–140 80–160
a)Hits-time
b)Energy-time
c) Amplitude-time
Fig. 24.10 A sample VS150-M acoustic emission characteristic parameter diagram
Table 24.5 The frequency distribution of the B sample (kHz)
Stage
VS150-M VS45-H VS900-M
Stage AB (elastic stage)
90–170
/
/
Stage BC (ascending stage of yield stage)
90–200
100–180 /
Stage DE (first half of plastic deformation stage)
80–170
/
70–120
Stage EF (the second half of the plastic deformation stage) /
/
/
Point F (when pulled off)
80–250
70–150
80–250
a)Hits-time
b)Energy-time
c) Amplitude-time
Fig. 24.11 B sample VS150-M acoustic emission characteristic parameter diagram
frequency distribution of the acoustic emission signals of the three sensors of the C
sample is shown in Table 24.6, and the stage are shown in Fig. 24.12c.
The time-domain and frequency-domain diagrams of typical acoustic emission
signals are shown in Fig. 24.9, which is the signal waveform and spectrum of the A
sample in the DE segment (the first half of the plastic deformation stage). The acoustic
emission signal frequency of the VS150-M sensor is distributed at 90–260 kHz,