

24 Experiment Research on Tensile Process …
285
Table 24.2 Acoustic emission acquisition parameter settings
Threshold value
(dB)
Sampling points
Sampling rate
(MHz)
Pre-sampling
pre-trigger
Duration
identification
time (µs)
40
1024
2.5
200
400
is set to 34 dB. The sensor layout is shown in Figs. 24.4, 24.5 and 24.6, where the
VS45 and VS900 sensors are fixed on one side of the sample, connected to channels
1 and 2 of the system, and the two VS150 sensors are fixed on the other side of the
sample and connected to channels 3 and 4 of the system. The sensor and the sample
are coupled by grease and fixed by adhesive tape. Acoustic emission acquisition
parameter settings are shown in Table 24.2.
The E45.305-30t universal testing machine is used for the tensile test. The
maximum tensile load of the equipment is 300 kN. In the test, the three types of
tensile samples were stretched at a constant rate of 4 mm/min until the samples
broke.
24.3 Test Results
24.3.1 The Tensile Properties of the Samples
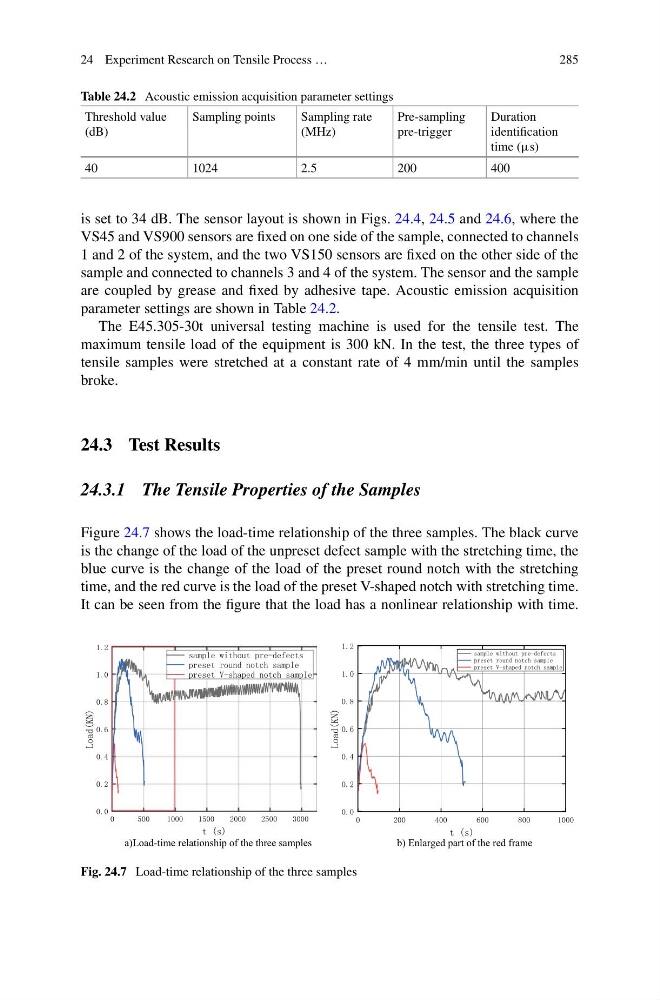
Figure 24.7 shows the load-time relationship of the three samples. The black curve
is the change of the load of the unpreset defect sample with the stretching time, the
blue curve is the change of the load of the preset round notch with the stretching
time, and the red curve is the load of the preset V-shaped notch with stretching time.
It can be seen from the figure that the load has a nonlinear relationship with time.
a)Load-time relationship of the three samples
b) Enlarged part of the red frame
Fig. 24.7 Load-time relationship of the three samples
285
Table 24.2 Acoustic emission acquisition parameter settings
Threshold value
(dB)
Sampling points
Sampling rate
(MHz)
Pre-sampling
pre-trigger
Duration
identification
time (µs)
40
1024
2.5
200
400
is set to 34 dB. The sensor layout is shown in Figs. 24.4, 24.5 and 24.6, where the
VS45 and VS900 sensors are fixed on one side of the sample, connected to channels
1 and 2 of the system, and the two VS150 sensors are fixed on the other side of the
sample and connected to channels 3 and 4 of the system. The sensor and the sample
are coupled by grease and fixed by adhesive tape. Acoustic emission acquisition
parameter settings are shown in Table 24.2.
The E45.305-30t universal testing machine is used for the tensile test. The
maximum tensile load of the equipment is 300 kN. In the test, the three types of
tensile samples were stretched at a constant rate of 4 mm/min until the samples
broke.
24.3 Test Results
24.3.1 The Tensile Properties of the Samples
Figure 24.7 shows the load-time relationship of the three samples. The black curve
is the change of the load of the unpreset defect sample with the stretching time, the
blue curve is the change of the load of the preset round notch with the stretching
time, and the red curve is the load of the preset V-shaped notch with stretching time.
It can be seen from the figure that the load has a nonlinear relationship with time.
a)Load-time relationship of the three samples
b) Enlarged part of the red frame
Fig. 24.7 Load-time relationship of the three samples