

21 High-Temperature Creep Damage Evolution of C/SiC …
243
21.4 Results and Discussion
21.4.1 C/SiC AE Signal Clustering
The frequency domain and time domain parameters of the recorded AE signal can
fully describe an acoustic signal accurately. However, in order to permit algorithmic
comparison of signals, the following characteristic features of the AE signal from
each sample were extracted as shown in Table 21.2.
Samples were analyzed using the method outlined in the previous section, with
the algorithm parameters set to K = 11, M = 5, and P = 6 for the data set generated
by each experiment (i.e. the set of AE events). The result of clustering analysis are
shown in Table 21.3. In the table, the optimal cluster number and the optimal feature
combination ID are obtained after the experimental data for each sample has been
processed by clustering analysis, and the corresponding index values and voting
scores of the three criteria are obtained.
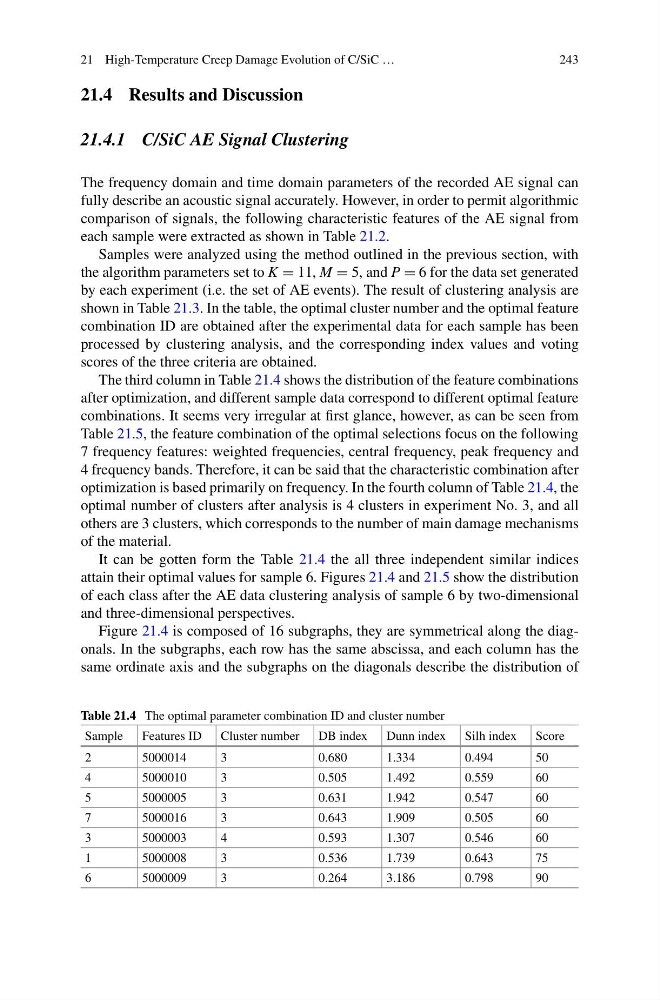
The third column in Table 21.4 shows the distribution of the feature combinations
after optimization, and different sample data correspond to different optimal feature
combinations. It seems very irregular at first glance, however, as can be seen from
Table 21.5, the feature combination of the optimal selections focus on the following
7 frequency features: weighted frequencies, central frequency, peak frequency and
4 frequency bands. Therefore, it can be said that the characteristic combination after
optimization is based primarily on frequency. In the fourth column of Table 21.4, the
optimal number of clusters after analysis is 4 clusters in experiment No. 3, and all
others are 3 clusters, which corresponds to the number of main damage mechanisms
of the material.
It can be gotten form the Table 21.4 the all three independent similar indices
attain their optimal values for sample 6. Figures 21.4 and 21.5 show the distribution
of each class after the AE data clustering analysis of sample 6 by two-dimensional
and three-dimensional perspectives.
Figure 21.4 is composed of 16 subgraphs, they are symmetrical along the diagonals. In the subgraphs, each row has the same abscissa, and each column has the
same ordinate axis and the subgraphs on the diagonals describe the distribution of
Table 21.4 The optimal parameter combination ID and cluster number
Sample Features ID Cluster number DB index Dunn index Silh index Score
2
5000014
3
0.680
1.334
0.494
50
4
5000010
3
0.505
1.492
0.559
60
5
5000005
3
0.631
1.942
0.547
60
7
5000016
3
0.643
1.909
0.505
60
3
5000003
4
0.593
1.307
0.546
60
1
5000008
3
0.536
1.739
0.643
75
6
5000009
3
0.264
3.186
0.798
90
243
21.4 Results and Discussion
21.4.1 C/SiC AE Signal Clustering
The frequency domain and time domain parameters of the recorded AE signal can
fully describe an acoustic signal accurately. However, in order to permit algorithmic
comparison of signals, the following characteristic features of the AE signal from
each sample were extracted as shown in Table 21.2.
Samples were analyzed using the method outlined in the previous section, with
the algorithm parameters set to K = 11, M = 5, and P = 6 for the data set generated
by each experiment (i.e. the set of AE events). The result of clustering analysis are
shown in Table 21.3. In the table, the optimal cluster number and the optimal feature
combination ID are obtained after the experimental data for each sample has been
processed by clustering analysis, and the corresponding index values and voting
scores of the three criteria are obtained.
The third column in Table 21.4 shows the distribution of the feature combinations
after optimization, and different sample data correspond to different optimal feature
combinations. It seems very irregular at first glance, however, as can be seen from
Table 21.5, the feature combination of the optimal selections focus on the following
7 frequency features: weighted frequencies, central frequency, peak frequency and
4 frequency bands. Therefore, it can be said that the characteristic combination after
optimization is based primarily on frequency. In the fourth column of Table 21.4, the
optimal number of clusters after analysis is 4 clusters in experiment No. 3, and all
others are 3 clusters, which corresponds to the number of main damage mechanisms
of the material.
It can be gotten form the Table 21.4 the all three independent similar indices
attain their optimal values for sample 6. Figures 21.4 and 21.5 show the distribution
of each class after the AE data clustering analysis of sample 6 by two-dimensional
and three-dimensional perspectives.
Figure 21.4 is composed of 16 subgraphs, they are symmetrical along the diagonals. In the subgraphs, each row has the same abscissa, and each column has the
same ordinate axis and the subgraphs on the diagonals describe the distribution of
Table 21.4 The optimal parameter combination ID and cluster number
Sample Features ID Cluster number DB index Dunn index Silh index Score
2
5000014
3
0.680
1.334
0.494
50
4
5000010
3
0.505
1.492
0.559
60
5
5000005
3
0.631
1.942
0.547
60
7
5000016
3
0.643
1.909
0.505
60
3
5000003
4
0.593
1.307
0.546
60
1
5000008
3
0.536
1.739
0.643
75
6
5000009
3
0.264
3.186
0.798
90