

192
Y. Zhang et al.
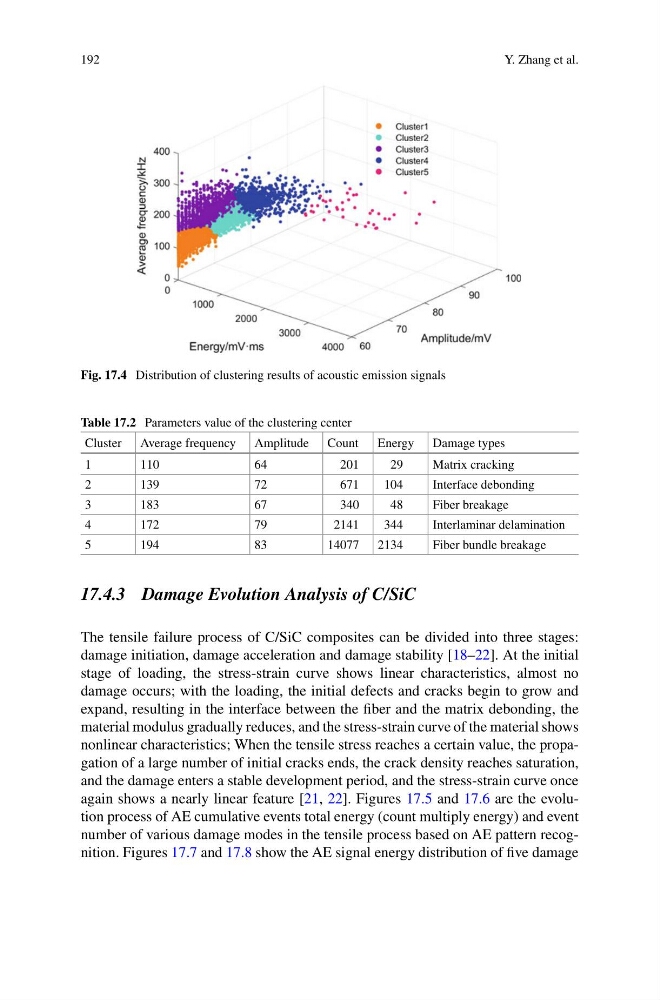
Fig. 17.4 Distribution of clustering results of acoustic emission signals
Table 17.2 Parameters value of the clustering center
Cluster Average frequency Amplitude Count
Energy Damage types
1
110
64
201
29
Matrix cracking
2
139
72
671
104
Interface debonding
3
183
67
340
48
Fiber breakage
4
172
79
2141
344
Interlaminar delamination
5
194
83
14077 2134
Fiber bundle breakage
17.4.3 Damage Evolution Analysis of C/SiC
The tensile failure process of C/SiC composites can be divided into three stages:
damage initiation, damage acceleration and damage stability [18–22]. At the initial
stage of loading, the stress-strain curve shows linear characteristics, almost no
damage occurs; with the loading, the initial defects and cracks begin to grow and
expand, resulting in the interface between the fiber and the matrix debonding, the
material modulus gradually reduces, and the stress-strain curve of the material shows
nonlinear characteristics; When the tensile stress reaches a certain value, the propagation of a large number of initial cracks ends, the crack density reaches saturation,
and the damage enters a stable development period, and the stress-strain curve once
again shows a nearly linear feature [21, 22]. Figures 17.5 and 17.6 are the evolution process of AE cumulative events total energy (count multiply energy) and event
number of various damage modes in the tensile process based on AE pattern recognition. Figures 17.7 and 17.8 show the AE signal energy distribution of five damage
Y. Zhang et al.
Fig. 17.4 Distribution of clustering results of acoustic emission signals
Table 17.2 Parameters value of the clustering center
Cluster Average frequency Amplitude Count
Energy Damage types
1
110
64
201
29
Matrix cracking
2
139
72
671
104
Interface debonding
3
183
67
340
48
Fiber breakage
4
172
79
2141
344
Interlaminar delamination
5
194
83
14077 2134
Fiber bundle breakage
17.4.3 Damage Evolution Analysis of C/SiC
The tensile failure process of C/SiC composites can be divided into three stages:
damage initiation, damage acceleration and damage stability [18–22]. At the initial
stage of loading, the stress-strain curve shows linear characteristics, almost no
damage occurs; with the loading, the initial defects and cracks begin to grow and
expand, resulting in the interface between the fiber and the matrix debonding, the
material modulus gradually reduces, and the stress-strain curve of the material shows
nonlinear characteristics; When the tensile stress reaches a certain value, the propagation of a large number of initial cracks ends, the crack density reaches saturation,
and the damage enters a stable development period, and the stress-strain curve once
again shows a nearly linear feature [21, 22]. Figures 17.5 and 17.6 are the evolution process of AE cumulative events total energy (count multiply energy) and event
number of various damage modes in the tensile process based on AE pattern recognition. Figures 17.7 and 17.8 show the AE signal energy distribution of five damage