

190
Y. Zhang et al.
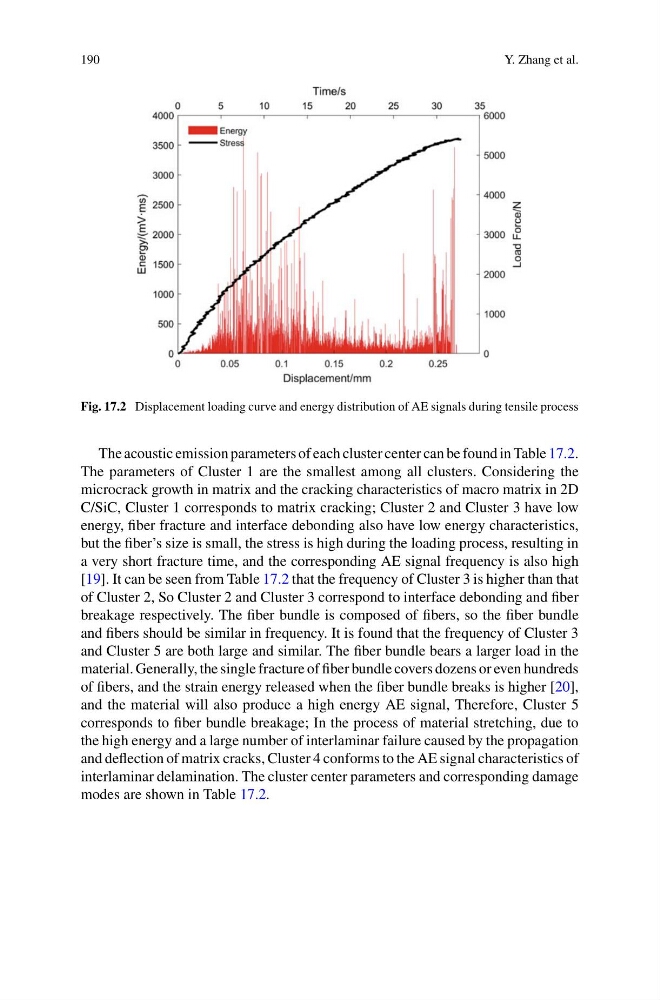
Fig. 17.2 Displacement loading curve and energy distribution of AE signals during tensile process
The acoustic emission parameters of each cluster center can be found in Table 17.2.
The parameters of Cluster 1 are the smallest among all clusters. Considering the
microcrack growth in matrix and the cracking characteristics of macro matrix in 2D
C/SiC, Cluster 1 corresponds to matrix cracking; Cluster 2 and Cluster 3 have low
energy, fiber fracture and interface debonding also have low energy characteristics,
but the fiber’s size is small, the stress is high during the loading process, resulting in
a very short fracture time, and the corresponding AE signal frequency is also high
[19]. It can be seen from Table 17.2 that the frequency of Cluster 3 is higher than that
of Cluster 2, So Cluster 2 and Cluster 3 correspond to interface debonding and fiber
breakage respectively. The fiber bundle is composed of fibers, so the fiber bundle
and fibers should be similar in frequency. It is found that the frequency of Cluster 3
and Cluster 5 are both large and similar. The fiber bundle bears a larger load in the
material. Generally, the single fracture of fiber bundle covers dozens or even hundreds
of fibers, and the strain energy released when the fiber bundle breaks is higher [20],
and the material will also produce a high energy AE signal, Therefore, Cluster 5
corresponds to fiber bundle breakage; In the process of material stretching, due to
the high energy and a large number of interlaminar failure caused by the propagation
and deflection of matrix cracks, Cluster 4 conforms to the AE signal characteristics of
interlaminar delamination. The cluster center parameters and corresponding damage
modes are shown in Table 17.2.
Y. Zhang et al.
Fig. 17.2 Displacement loading curve and energy distribution of AE signals during tensile process
The acoustic emission parameters of each cluster center can be found in Table 17.2.
The parameters of Cluster 1 are the smallest among all clusters. Considering the
microcrack growth in matrix and the cracking characteristics of macro matrix in 2D
C/SiC, Cluster 1 corresponds to matrix cracking; Cluster 2 and Cluster 3 have low
energy, fiber fracture and interface debonding also have low energy characteristics,
but the fiber’s size is small, the stress is high during the loading process, resulting in
a very short fracture time, and the corresponding AE signal frequency is also high
[19]. It can be seen from Table 17.2 that the frequency of Cluster 3 is higher than that
of Cluster 2, So Cluster 2 and Cluster 3 correspond to interface debonding and fiber
breakage respectively. The fiber bundle is composed of fibers, so the fiber bundle
and fibers should be similar in frequency. It is found that the frequency of Cluster 3
and Cluster 5 are both large and similar. The fiber bundle bears a larger load in the
material. Generally, the single fracture of fiber bundle covers dozens or even hundreds
of fibers, and the strain energy released when the fiber bundle breaks is higher [20],
and the material will also produce a high energy AE signal, Therefore, Cluster 5
corresponds to fiber bundle breakage; In the process of material stretching, due to
the high energy and a large number of interlaminar failure caused by the propagation
and deflection of matrix cracks, Cluster 4 conforms to the AE signal characteristics of
interlaminar delamination. The cluster center parameters and corresponding damage
modes are shown in Table 17.2.