

15 Research on AE Source Location …
163
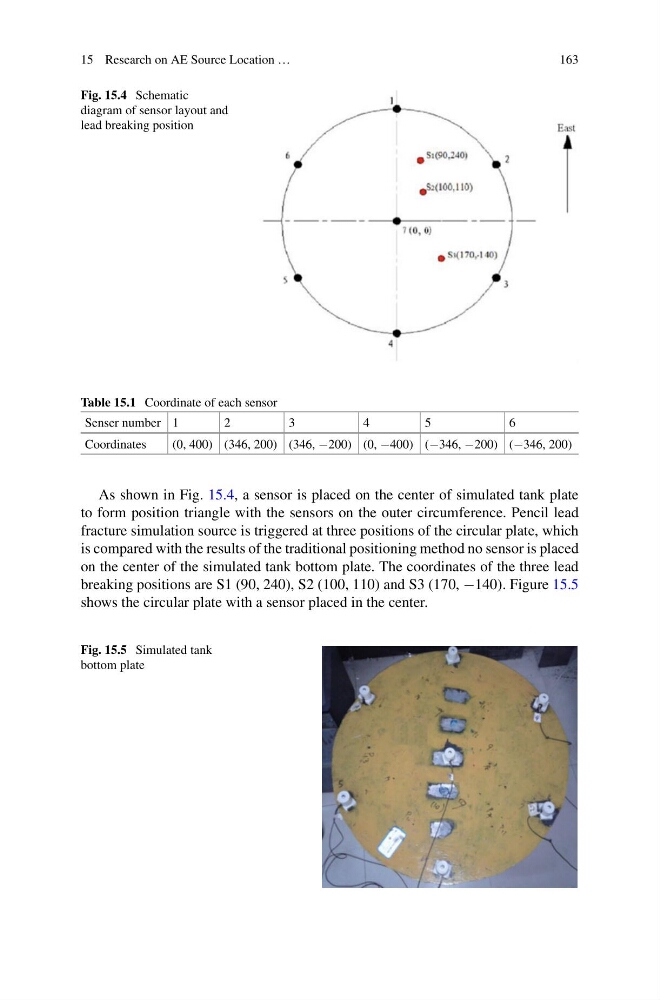
Fig. 15.4 Schematic
diagram of sensor layout and
lead breaking position
Table 15.1 Coordinate of each sensor
Senser number 1
2
3
4
5
6
Coordinates
(0, 400) (346, 200) (346, −200) (0, −400) (−346, −200) (−346, 200)
As shown in Fig. 15.4, a sensor is placed on the center of simulated tank plate
to form position triangle with the sensors on the outer circumference. Pencil lead
fracture simulation source is triggered at three positions of the circular plate, which
is compared with the results of the traditional positioning method no sensor is placed
on the center of the simulated tank bottom plate. The coordinates of the three lead
breaking positions are S1 (90, 240), S2 (100, 110) and S3 (170, −140). Figure 15.5
shows the circular plate with a sensor placed in the center.
Fig. 15.5 Simulated tank
bottom plate
163
Fig. 15.4 Schematic
diagram of sensor layout and
lead breaking position
Table 15.1 Coordinate of each sensor
Senser number 1
2
3
4
5
6
Coordinates
(0, 400) (346, 200) (346, −200) (0, −400) (−346, −200) (−346, 200)
As shown in Fig. 15.4, a sensor is placed on the center of simulated tank plate
to form position triangle with the sensors on the outer circumference. Pencil lead
fracture simulation source is triggered at three positions of the circular plate, which
is compared with the results of the traditional positioning method no sensor is placed
on the center of the simulated tank bottom plate. The coordinates of the three lead
breaking positions are S1 (90, 240), S2 (100, 110) and S3 (170, −140). Figure 15.5
shows the circular plate with a sensor placed in the center.
Fig. 15.5 Simulated tank
bottom plate