

13 Fatigue Evolution of Ball Bearing with Improved Acoustic …
143
5
105
205
305
405
505
605
705
805
905
1005
1105
t / min
0.1
0.2
0.3
0.4
0.5
0.6
0.7
0.8
Duration t/ms
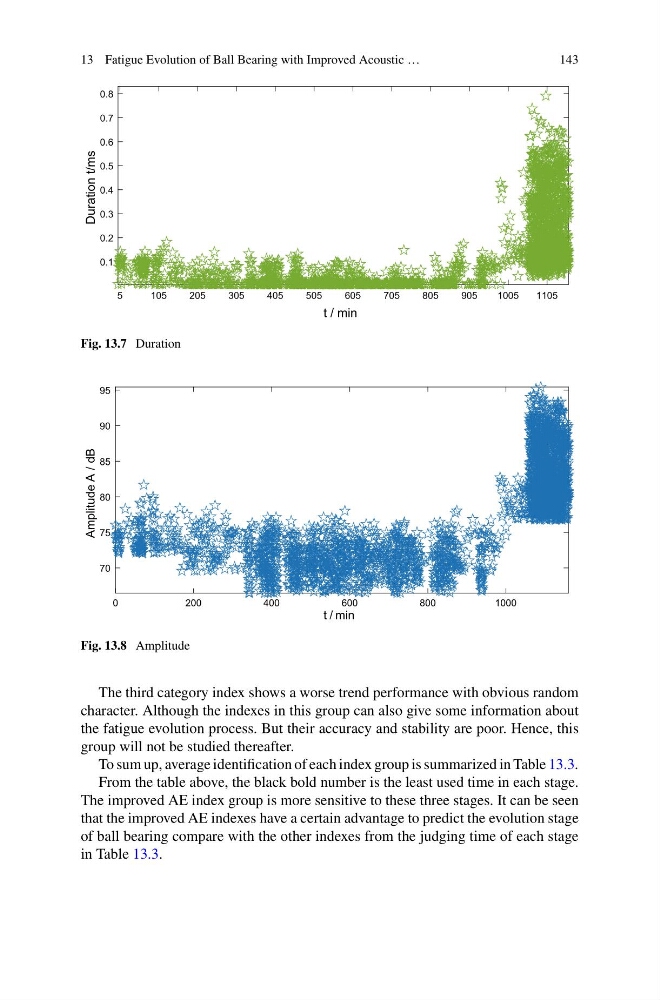
Fig. 13.7 Duration
0
200
400
600
800
1000
t / min
70
75
80
85
90
95
Amplitude A / dB
Fig. 13.8 Amplitude
The third category index shows a worse trend performance with obvious random
character. Although the indexes in this group can also give some information about
the fatigue evolution process. But their accuracy and stability are poor. Hence, this
group will not be studied thereafter.
To sum up, average identification of each index group is summarized in Table 13.3.
From the table above, the black bold number is the least used time in each stage.
The improved AE index group is more sensitive to these three stages. It can be seen
that the improved AE indexes have a certain advantage to predict the evolution stage
of ball bearing compare with the other indexes from the judging time of each stage
in Table 13.3.
143
5
105
205
305
405
505
605
705
805
905
1005
1105
t / min
0.1
0.2
0.3
0.4
0.5
0.6
0.7
0.8
Duration t/ms
Fig. 13.7 Duration
0
200
400
600
800
1000
t / min
70
75
80
85
90
95
Amplitude A / dB
Fig. 13.8 Amplitude
The third category index shows a worse trend performance with obvious random
character. Although the indexes in this group can also give some information about
the fatigue evolution process. But their accuracy and stability are poor. Hence, this
group will not be studied thereafter.
To sum up, average identification of each index group is summarized in Table 13.3.
From the table above, the black bold number is the least used time in each stage.
The improved AE index group is more sensitive to these three stages. It can be seen
that the improved AE indexes have a certain advantage to predict the evolution stage
of ball bearing compare with the other indexes from the judging time of each stage
in Table 13.3.