

132
Y. Yu et al.
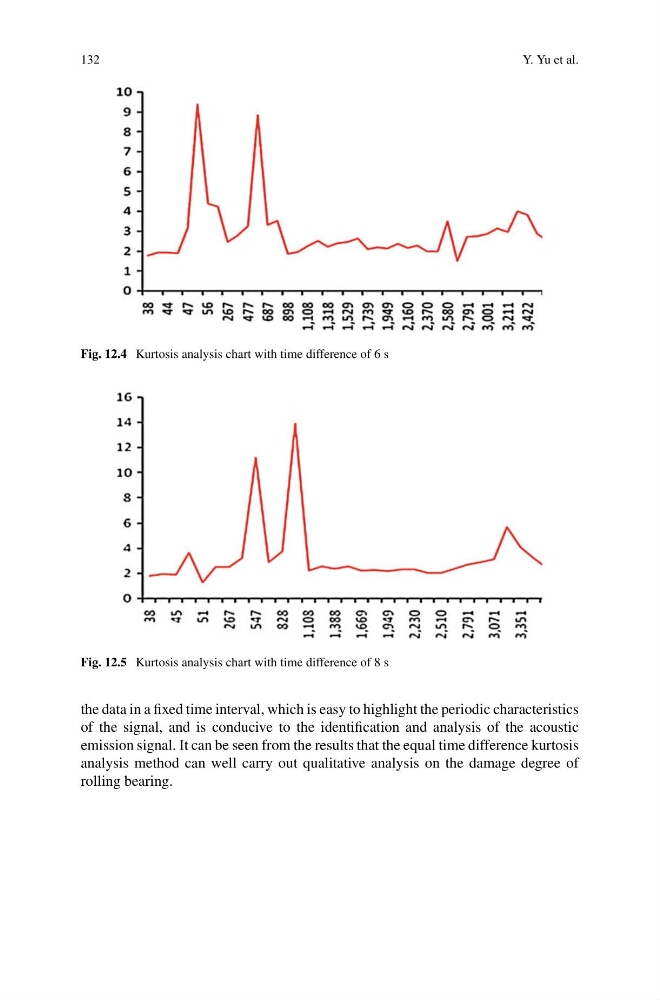
Fig. 12.4 Kurtosis analysis chart with time difference of 6 s
Fig. 12.5 Kurtosis analysis chart with time difference of 8 s
the data in a fixed time interval, which is easy to highlight the periodic characteristics
of the signal, and is conducive to the identification and analysis of the acoustic
emission signal. It can be seen from the results that the equal time difference kurtosis
analysis method can well carry out qualitative analysis on the damage degree of
rolling bearing.
Y. Yu et al.
Fig. 12.4 Kurtosis analysis chart with time difference of 6 s
Fig. 12.5 Kurtosis analysis chart with time difference of 8 s
the data in a fixed time interval, which is easy to highlight the periodic characteristics
of the signal, and is conducive to the identification and analysis of the acoustic
emission signal. It can be seen from the results that the equal time difference kurtosis
analysis method can well carry out qualitative analysis on the damage degree of
rolling bearing.