

9 Burst Analysis for Multi-Level Leakage Detection in Water-Filled Pipeline …
101
signal characteristics. When the scale increases, noise extremes decay while the
noise-free signal can be obtained. The noise in each level is evaluated based on the
standard deviation of the detail coefficients and is computed as the threshold. After
the burst detection stage, the same procedure of signal characteristics calculation
and classification with OAA-MCSVMs is applied for the burst segment signals. The
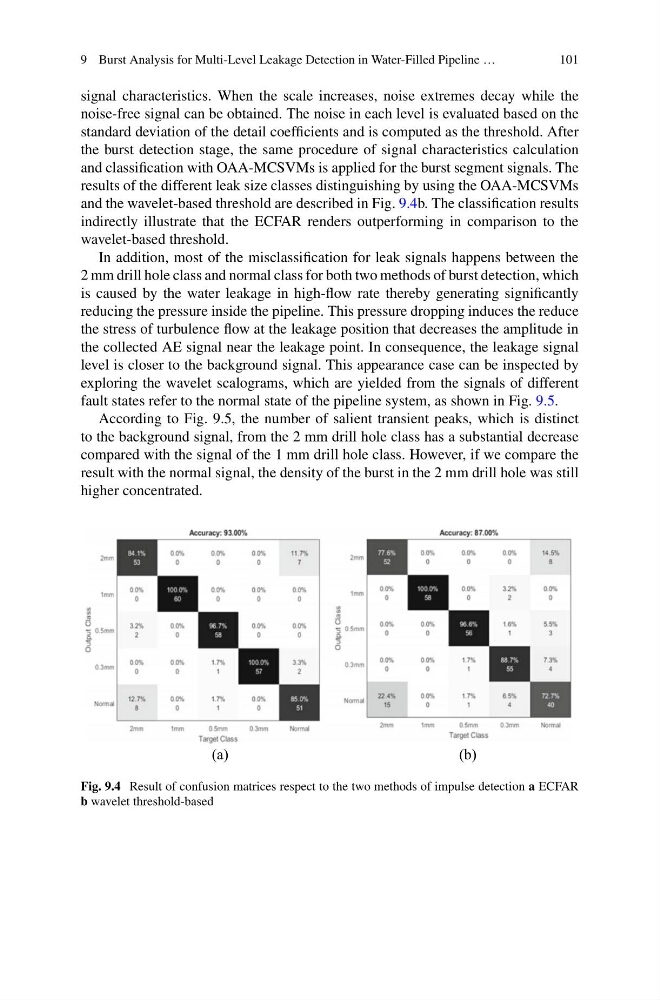
results of the different leak size classes distinguishing by using the OAA-MCSVMs
and the wavelet-based threshold are described in Fig. 9.4b. The classification results
indirectly illustrate that the ECFAR renders outperforming in comparison to the
wavelet-based threshold.
In addition, most of the misclassification for leak signals happens between the
2 mm drill hole class and normal class for both two methods of burst detection, which
is caused by the water leakage in high-flow rate thereby generating significantly
reducing the pressure inside the pipeline. This pressure dropping induces the reduce
the stress of turbulence flow at the leakage position that decreases the amplitude in
the collected AE signal near the leakage point. In consequence, the leakage signal
level is closer to the background signal. This appearance case can be inspected by
exploring the wavelet scalograms, which are yielded from the signals of different
fault states refer to the normal state of the pipeline system, as shown in Fig. 9.5.
According to Fig. 9.5, the number of salient transient peaks, which is distinct
to the background signal, from the 2 mm drill hole class has a substantial decrease
compared with the signal of the 1 mm drill hole class. However, if we compare the
result with the normal signal, the density of the burst in the 2 mm drill hole was still
higher concentrated.
(b)
(a)
Fig. 9.4 Result of confusion matrices respect to the two methods of impulse detection a ECFAR
b wavelet threshold-based
101
signal characteristics. When the scale increases, noise extremes decay while the
noise-free signal can be obtained. The noise in each level is evaluated based on the
standard deviation of the detail coefficients and is computed as the threshold. After
the burst detection stage, the same procedure of signal characteristics calculation
and classification with OAA-MCSVMs is applied for the burst segment signals. The
results of the different leak size classes distinguishing by using the OAA-MCSVMs
and the wavelet-based threshold are described in Fig. 9.4b. The classification results
indirectly illustrate that the ECFAR renders outperforming in comparison to the
wavelet-based threshold.
In addition, most of the misclassification for leak signals happens between the
2 mm drill hole class and normal class for both two methods of burst detection, which
is caused by the water leakage in high-flow rate thereby generating significantly
reducing the pressure inside the pipeline. This pressure dropping induces the reduce
the stress of turbulence flow at the leakage position that decreases the amplitude in
the collected AE signal near the leakage point. In consequence, the leakage signal
level is closer to the background signal. This appearance case can be inspected by
exploring the wavelet scalograms, which are yielded from the signals of different
fault states refer to the normal state of the pipeline system, as shown in Fig. 9.5.
According to Fig. 9.5, the number of salient transient peaks, which is distinct
to the background signal, from the 2 mm drill hole class has a substantial decrease
compared with the signal of the 1 mm drill hole class. However, if we compare the
result with the normal signal, the density of the burst in the 2 mm drill hole was still
higher concentrated.
(b)
(a)
Fig. 9.4 Result of confusion matrices respect to the two methods of impulse detection a ECFAR
b wavelet threshold-based