

8 Acoustic Emission and Dual-Tree Complex Wavelet Transform …
89
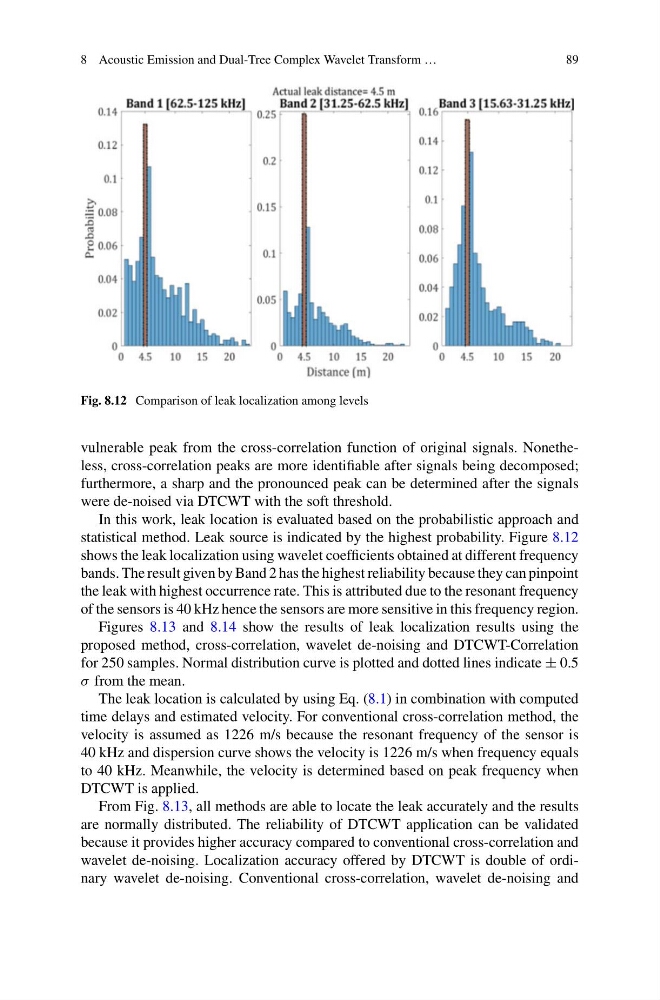
Fig. 8.12 Comparison of leak localization among levels
vulnerable peak from the cross-correlation function of original signals. Nonetheless, cross-correlation peaks are more identifiable after signals being decomposed;
furthermore, a sharp and the pronounced peak can be determined after the signals
were de-noised via DTCWT with the soft threshold.
In this work, leak location is evaluated based on the probabilistic approach and
statistical method. Leak source is indicated by the highest probability. Figure 8.12
shows the leak localization using wavelet coefficients obtained at different frequency
bands. The result given by Band 2 has the highest reliability because they can pinpoint
the leak with highest occurrence rate. This is attributed due to the resonant frequency
of the sensors is 40 kHz hence the sensors are more sensitive in this frequency region.
Figures 8.13 and 8.14 show the results of leak localization results using the
proposed method, cross-correlation, wavelet de-noising and DTCWT-Correlation
for 250 samples. Normal distribution curve is plotted and dotted lines indicate ± 0.5
σ from the mean.
The leak location is calculated by using Eq. (8.1) in combination with computed
time delays and estimated velocity. For conventional cross-correlation method, the
velocity is assumed as 1226 m/s because the resonant frequency of the sensor is
40 kHz and dispersion curve shows the velocity is 1226 m/s when frequency equals
to 40 kHz. Meanwhile, the velocity is determined based on peak frequency when
DTCWT is applied.
From Fig. 8.13, all methods are able to locate the leak accurately and the results
are normally distributed. The reliability of DTCWT application can be validated
because it provides higher accuracy compared to conventional cross-correlation and
wavelet de-noising. Localization accuracy offered by DTCWT is double of ordinary wavelet de-noising. Conventional cross-correlation, wavelet de-noising and
89
Fig. 8.12 Comparison of leak localization among levels
vulnerable peak from the cross-correlation function of original signals. Nonetheless, cross-correlation peaks are more identifiable after signals being decomposed;
furthermore, a sharp and the pronounced peak can be determined after the signals
were de-noised via DTCWT with the soft threshold.
In this work, leak location is evaluated based on the probabilistic approach and
statistical method. Leak source is indicated by the highest probability. Figure 8.12
shows the leak localization using wavelet coefficients obtained at different frequency
bands. The result given by Band 2 has the highest reliability because they can pinpoint
the leak with highest occurrence rate. This is attributed due to the resonant frequency
of the sensors is 40 kHz hence the sensors are more sensitive in this frequency region.
Figures 8.13 and 8.14 show the results of leak localization results using the
proposed method, cross-correlation, wavelet de-noising and DTCWT-Correlation
for 250 samples. Normal distribution curve is plotted and dotted lines indicate ± 0.5
σ from the mean.
The leak location is calculated by using Eq. (8.1) in combination with computed
time delays and estimated velocity. For conventional cross-correlation method, the
velocity is assumed as 1226 m/s because the resonant frequency of the sensor is
40 kHz and dispersion curve shows the velocity is 1226 m/s when frequency equals
to 40 kHz. Meanwhile, the velocity is determined based on peak frequency when
DTCWT is applied.
From Fig. 8.13, all methods are able to locate the leak accurately and the results
are normally distributed. The reliability of DTCWT application can be validated
because it provides higher accuracy compared to conventional cross-correlation and
wavelet de-noising. Localization accuracy offered by DTCWT is double of ordinary wavelet de-noising. Conventional cross-correlation, wavelet de-noising and