

Surface Nanostructuring of Metallic Materials …
499
SMAT on the microstructure, phase content, phase transformation, grain size, surface
roughness, hardness and, corrosion resistance of CoCrMo alloy is addressed in the
following paragraphs.
Unlike stainless steel, Ti and Ti alloys, and Ni-Ti alloys, SMAT of CoCrMo alloys
has not been studied much. The benefits of surface nanocrystallization of Co28Cr6Mo
alloy by SMAT in improving the abrasive wear properties were addressed by
Demangel et al. [84]. The microstructural characteristics of CoCrMo alloy subjected
to SMAT were evaluated by Proust et al. [85]. The influence of SMAT on the corrosion
behavior of Co28Cr6Mo alloy in Ringer’s solution was studied by Tchana Nkonta
et al. [19].
The XRD pattern of the as-polished Co28Cr6Mo alloy reveals the presence of
austenite (γ-fcc) and martensite (E-hcp) phases. After SMAT, the intensity of the
(111γ) and (200γ) peaks are decreased concomitant with an increase in intensity of
the (101ε) peak, suggesting the formation of more amounts of martensite (E-hcp)
phase at the expense of the austenite phase [19]. The mechanism of such transformation is believed to be similar to the observed during SMAT of cobalt, which
also possesses both hcp and fcc phases [86]. Accordingly, the strain-induced during
SMAT is accommodated by the fcc phase. At lower strain, slip dislocations leading
to the formation of intersecting planar arrays of dislocations are likely to occur. At
higher strain, a transformation of the fcc to hcp phase occurs.
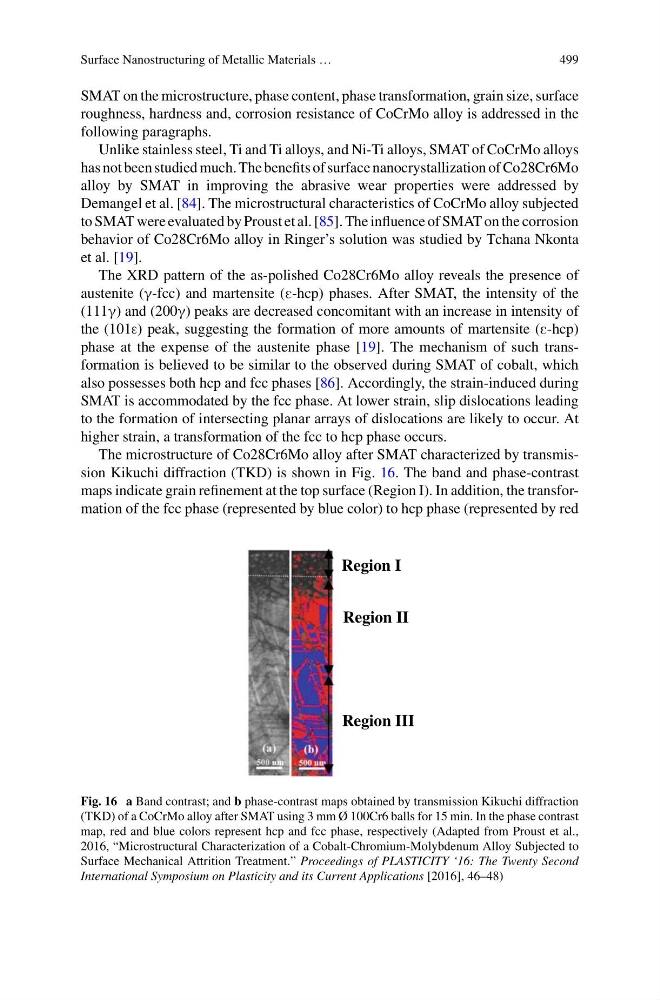
The microstructure of Co28Cr6Mo alloy after SMAT characterized by transmission Kikuchi diffraction (TKD) is shown in Fig. 16. The band and phase-contrast
maps indicate grain refinement at the top surface (Region I). In addition, the transformation of the fcc phase (represented by blue color) to hcp phase (represented by red
Region I
Region II
Region III
Fig. 16 a Band contrast; and b phase-contrast maps obtained by transmission Kikuchi diffraction
(TKD) of a CoCrMo alloy after SMAT using 3 mm Ø 100Cr6 balls for 15 min. In the phase contrast
map, red and blue colors represent hcp and fcc phase, respectively (Adapted from Proust et al.,
2016, “Microstructural Characterization of a Cobalt-Chromium-Molybdenum Alloy Subjected to
Surface Mechanical Attrition Treatment.” Proceedings of PLASTICITY ‘16: The Twenty Second
International Symposium on Plasticity and its Current Applications [2016], 46–48)
499
SMAT on the microstructure, phase content, phase transformation, grain size, surface
roughness, hardness and, corrosion resistance of CoCrMo alloy is addressed in the
following paragraphs.
Unlike stainless steel, Ti and Ti alloys, and Ni-Ti alloys, SMAT of CoCrMo alloys
has not been studied much. The benefits of surface nanocrystallization of Co28Cr6Mo
alloy by SMAT in improving the abrasive wear properties were addressed by
Demangel et al. [84]. The microstructural characteristics of CoCrMo alloy subjected
to SMAT were evaluated by Proust et al. [85]. The influence of SMAT on the corrosion
behavior of Co28Cr6Mo alloy in Ringer’s solution was studied by Tchana Nkonta
et al. [19].
The XRD pattern of the as-polished Co28Cr6Mo alloy reveals the presence of
austenite (γ-fcc) and martensite (E-hcp) phases. After SMAT, the intensity of the
(111γ) and (200γ) peaks are decreased concomitant with an increase in intensity of
the (101ε) peak, suggesting the formation of more amounts of martensite (E-hcp)
phase at the expense of the austenite phase [19]. The mechanism of such transformation is believed to be similar to the observed during SMAT of cobalt, which
also possesses both hcp and fcc phases [86]. Accordingly, the strain-induced during
SMAT is accommodated by the fcc phase. At lower strain, slip dislocations leading
to the formation of intersecting planar arrays of dislocations are likely to occur. At
higher strain, a transformation of the fcc to hcp phase occurs.
The microstructure of Co28Cr6Mo alloy after SMAT characterized by transmission Kikuchi diffraction (TKD) is shown in Fig. 16. The band and phase-contrast
maps indicate grain refinement at the top surface (Region I). In addition, the transformation of the fcc phase (represented by blue color) to hcp phase (represented by red
Region I
Region II
Region III
Fig. 16 a Band contrast; and b phase-contrast maps obtained by transmission Kikuchi diffraction
(TKD) of a CoCrMo alloy after SMAT using 3 mm Ø 100Cr6 balls for 15 min. In the phase contrast
map, red and blue colors represent hcp and fcc phase, respectively (Adapted from Proust et al.,
2016, “Microstructural Characterization of a Cobalt-Chromium-Molybdenum Alloy Subjected to
Surface Mechanical Attrition Treatment.” Proceedings of PLASTICITY ‘16: The Twenty Second
International Symposium on Plasticity and its Current Applications [2016], 46–48)