

9.8 Diamagnetic Hydrogen
333
9.8.3 Experiment
Over the years there have been a series of experiments which measure the absorption
cross section of Rydberg-type atoms in a constant magnetic field (Garton and
Tomkins 1969; Zimmerman et al. 1978; Kleppner et al. 1981; Holle et al. 1986;
Main et al. 1986, 1994). In this section, we shall focus on the experiment of Main
et al. (1994) which uses hydrogen atoms and in the next section we compare the
results of that experiment to the predictions of semiclassical physics.
The experiment of Main et al. (Main et al. 1994) measured the absorption cross
section of hydrogen atoms in a constant magnetic field. The magnetic field, with
values ranging from B = 2 T to B = 6 T, was directed along the z-axis. A beam
of hydrogen atoms was also directed along the z-axis. Two crossed laser beams
were used to excite the hydrogen atoms. A vacuum ultraviolet laser (vuv) directed
along the y-axis, with polarization along the z-axis, and an ultraviolet beam (uv)
directed along the x-axis, with polarization along the z-axis, excited the hydrogen
atoms from their ground state into a range of highly excited states. The interaction
region was shielded by a pair of flat fine-mesh grid electrodes on either side in the
x − y plane. The atoms were subsequently ionized by a third electrode outside the
interaction region.
The experiment of Main et al. used a technique of scaled-variable spectroscopy.
Spectra were taken along lines of fixed as a function of w = 2πγ −1/3 . This is
done by simultaneously adjusting the magnetic field strength and the wavelength
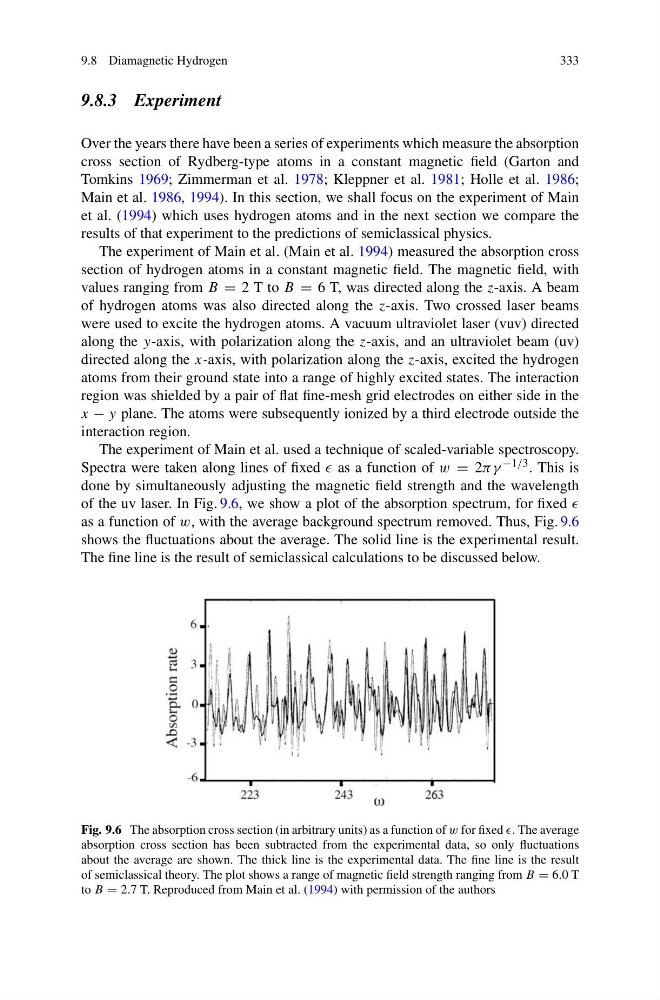
of the uv laser. In Fig. 9.6, we show a plot of the absorption spectrum, for fixed
as a function of w, with the average background spectrum removed. Thus, Fig. 9.6
shows the fluctuations about the average. The solid line is the experimental result.
The fine line is the result of semiclassical calculations to be discussed below.
Fig. 9.6 The absorption cross section (in arbitrary units) as a function of w for fixed . The average
absorption cross section has been subtracted from the experimental data, so only fluctuations
about the average are shown. The thick line is the experimental data. The fine line is the result
of semiclassical theory. The plot shows a range of magnetic field strength ranging from B = 6.0 T
to B = 2.7 T. Reproduced from Main et al. (1994) with permission of the authors
333
9.8.3 Experiment
Over the years there have been a series of experiments which measure the absorption
cross section of Rydberg-type atoms in a constant magnetic field (Garton and
Tomkins 1969; Zimmerman et al. 1978; Kleppner et al. 1981; Holle et al. 1986;
Main et al. 1986, 1994). In this section, we shall focus on the experiment of Main
et al. (1994) which uses hydrogen atoms and in the next section we compare the
results of that experiment to the predictions of semiclassical physics.
The experiment of Main et al. (Main et al. 1994) measured the absorption cross
section of hydrogen atoms in a constant magnetic field. The magnetic field, with
values ranging from B = 2 T to B = 6 T, was directed along the z-axis. A beam
of hydrogen atoms was also directed along the z-axis. Two crossed laser beams
were used to excite the hydrogen atoms. A vacuum ultraviolet laser (vuv) directed
along the y-axis, with polarization along the z-axis, and an ultraviolet beam (uv)
directed along the x-axis, with polarization along the z-axis, excited the hydrogen
atoms from their ground state into a range of highly excited states. The interaction
region was shielded by a pair of flat fine-mesh grid electrodes on either side in the
x − y plane. The atoms were subsequently ionized by a third electrode outside the
interaction region.
The experiment of Main et al. used a technique of scaled-variable spectroscopy.
Spectra were taken along lines of fixed as a function of w = 2πγ −1/3 . This is
done by simultaneously adjusting the magnetic field strength and the wavelength
of the uv laser. In Fig. 9.6, we show a plot of the absorption spectrum, for fixed
as a function of w, with the average background spectrum removed. Thus, Fig. 9.6
shows the fluctuations about the average. The solid line is the experimental result.
The fine line is the result of semiclassical calculations to be discussed below.
Fig. 9.6 The absorption cross section (in arbitrary units) as a function of w for fixed . The average
absorption cross section has been subtracted from the experimental data, so only fluctuations
about the average are shown. The thick line is the experimental data. The fine line is the result
of semiclassical theory. The plot shows a range of magnetic field strength ranging from B = 6.0 T
to B = 2.7 T. Reproduced from Main et al. (1994) with permission of the authors