

288
8 Manifestations of Chaos in Quantum Scattering Processes
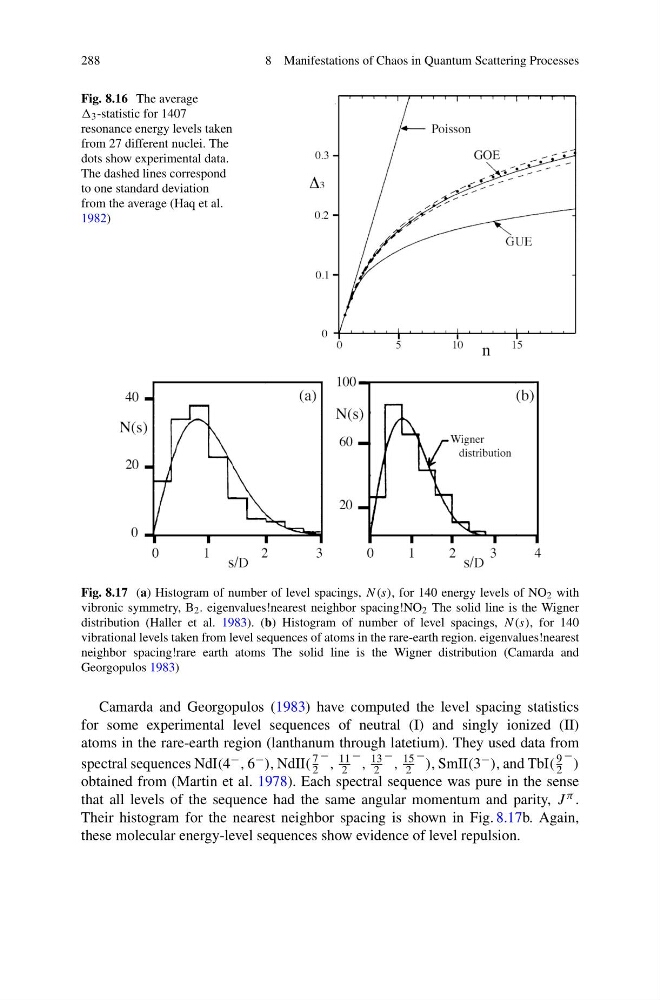
Fig. 8.16 The average
3 -statistic for 1407
resonance energy levels taken
from 27 different nuclei. The
dots show experimental data.
The dashed lines correspond
to one standard deviation
from the average (Haq et al.
1982)
Fig. 8.17 (a) Histogram of number of level spacings, N(s), for 140 energy levels of NO 2 with
vibronic symmetry, B 2 . eigenvalues!nearest neighbor spacing!NO 2 The solid line is the Wigner
distribution (Haller et al. 1983). (b) Histogram of number of level spacings, N(s), for 140
vibrational levels taken from level sequences of atoms in the rare-earth region. eigenvalues!nearest
neighbor spacing!rare earth atoms The solid line is the Wigner distribution (Camarda and
Georgopulos 1983)
Camarda and Georgopulos (1983) have computed the level spacing statistics
for some experimental level sequences of neutral (I) and singly ionized (II)
atoms in the rare-earth region (lanthanum through latetium). They used data from
spectral sequences NdI(4 − , 6 − ), NdII(
7
2
− ,
11
2
− ,
13
2
− ,
15
2
− ), SmII(3 − ), and TbI(
9
2
− )
obtained from (Martin et al. 1978). Each spectral sequence was pure in the sense
that all levels of the sequence had the same angular momentum and parity, J π .
Their histogram for the nearest neighbor spacing is shown in Fig. 8.17b. Again,
these molecular energy-level sequences show evidence of level repulsion.
8 Manifestations of Chaos in Quantum Scattering Processes
Fig. 8.16 The average
3 -statistic for 1407
resonance energy levels taken
from 27 different nuclei. The
dots show experimental data.
The dashed lines correspond
to one standard deviation
from the average (Haq et al.
1982)
Fig. 8.17 (a) Histogram of number of level spacings, N(s), for 140 energy levels of NO 2 with
vibronic symmetry, B 2 . eigenvalues!nearest neighbor spacing!NO 2 The solid line is the Wigner
distribution (Haller et al. 1983). (b) Histogram of number of level spacings, N(s), for 140
vibrational levels taken from level sequences of atoms in the rare-earth region. eigenvalues!nearest
neighbor spacing!rare earth atoms The solid line is the Wigner distribution (Camarda and
Georgopulos 1983)
Camarda and Georgopulos (1983) have computed the level spacing statistics
for some experimental level sequences of neutral (I) and singly ionized (II)
atoms in the rare-earth region (lanthanum through latetium). They used data from
spectral sequences NdI(4 − , 6 − ), NdII(
7
2
− ,
11
2
− ,
13
2
− ,
15
2
− ), SmII(3 − ), and TbI(
9
2
− )
obtained from (Martin et al. 1978). Each spectral sequence was pure in the sense
that all levels of the sequence had the same angular momentum and parity, J π .
Their histogram for the nearest neighbor spacing is shown in Fig. 8.17b. Again,
these molecular energy-level sequences show evidence of level repulsion.