

referred to as the ‘Design of Experiment’. On the one hand, these simulations have
to be limited in number due to their computational time, but, on the other hand, they
must be able to represent as closely as possible the cause-effect relationship
between precursor emissions and the considered AQIs.
The overall solution procedure implemented in RIAT+ is presented in Fig. 5.3,
which shows how local data, CTM simulation and problem statement are combined
to determine the overall results. These can in turn be analysed under different views:
values and costs of measures in different sectors, spatial distribution of emissions
and AQIs, efficient trade-offs between costs and AQIs (see Fig. 5.4).
RIAT+ IAM system has been used in support of air quality planning in Brussels
Capital Region (Belgium) and in the Great Porto Area (Portugal). The results of
such applications are briefly sketched in the next sections.
5.3 Brussels Capital Region
The Brussels Capital Region (BCR) has an area of 161 km
2 and is home to more
than 1.1 million people. The region consists of 19 municipalities, one of which is
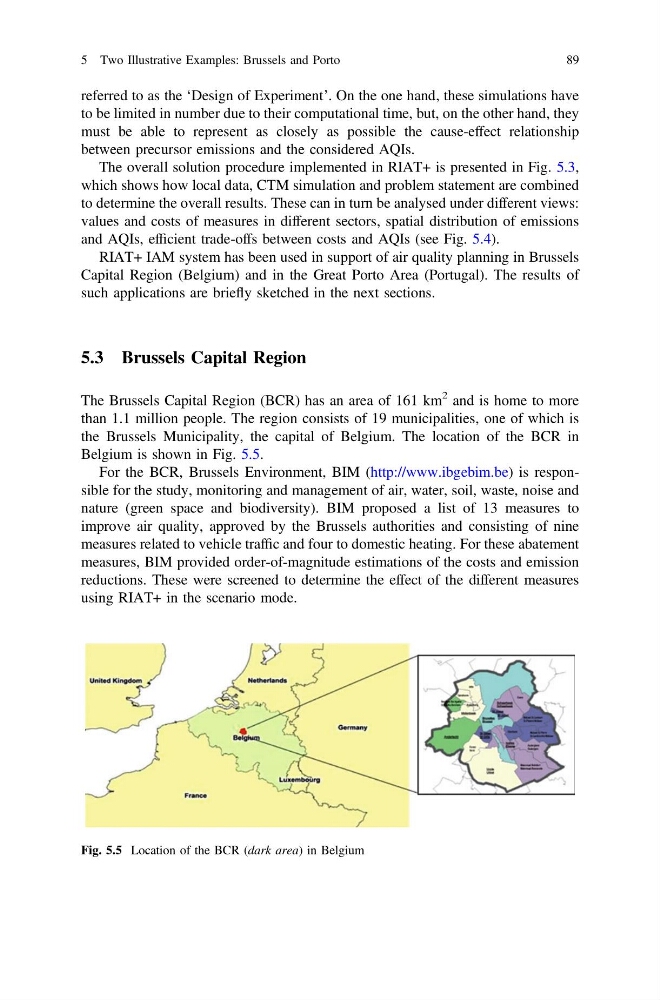
the Brussels Municipality, the capital of Belgium. The location of the BCR in
Belgium is shown in Fig. 5.5.
For the BCR, Brussels Environment, BIM (http://www.ibgebim.be) is responsible for the study, monitoring and management of air, water, soil, waste, noise and
nature (green space and biodiversity). BIM proposed a list of 13 measures to
improve air quality, approved by the Brussels authorities and consisting of nine
measures related to vehicle traffic and four to domestic heating. For these abatement
measures, BIM provided order-of-magnitude estimations of the costs and emission
reductions. These were screened to determine the effect of the different measures
using RIAT+ in the scenario mode.
Fig. 5.5 Location of the BCR (dark area) in Belgium
5 Two Illustrative Examples: Brussels and Porto
89
to be limited in number due to their computational time, but, on the other hand, they
must be able to represent as closely as possible the cause-effect relationship
between precursor emissions and the considered AQIs.
The overall solution procedure implemented in RIAT+ is presented in Fig. 5.3,
which shows how local data, CTM simulation and problem statement are combined
to determine the overall results. These can in turn be analysed under different views:
values and costs of measures in different sectors, spatial distribution of emissions
and AQIs, efficient trade-offs between costs and AQIs (see Fig. 5.4).
RIAT+ IAM system has been used in support of air quality planning in Brussels
Capital Region (Belgium) and in the Great Porto Area (Portugal). The results of
such applications are briefly sketched in the next sections.
5.3 Brussels Capital Region
The Brussels Capital Region (BCR) has an area of 161 km
2 and is home to more
than 1.1 million people. The region consists of 19 municipalities, one of which is
the Brussels Municipality, the capital of Belgium. The location of the BCR in
Belgium is shown in Fig. 5.5.
For the BCR, Brussels Environment, BIM (http://www.ibgebim.be) is responsible for the study, monitoring and management of air, water, soil, waste, noise and
nature (green space and biodiversity). BIM proposed a list of 13 measures to
improve air quality, approved by the Brussels authorities and consisting of nine
measures related to vehicle traffic and four to domestic heating. For these abatement
measures, BIM provided order-of-magnitude estimations of the costs and emission
reductions. These were screened to determine the effect of the different measures
using RIAT+ in the scenario mode.
Fig. 5.5 Location of the BCR (dark area) in Belgium
5 Two Illustrative Examples: Brussels and Porto
89