

Influence of the Electron–Phonon Interaction on the Topological Phase. . .
311
Pressure(GPa)
0
0
1
2
3
4
5
50
100
150
200
250
300
a
b
Gap energy(meV)
Z 2 = 0
Z 2 = 1
⇐ WSM
ωLO max
DFPT
←H
A
L→
-0.6
-0.4
-0.2
0.0
0.2
0.4
0.6
0.8
E-E
F (eV)
0 GPa
←H
A
L→
5 GPa (kz=1.077 π/c)
5pz
Te+I
6pz
Bi
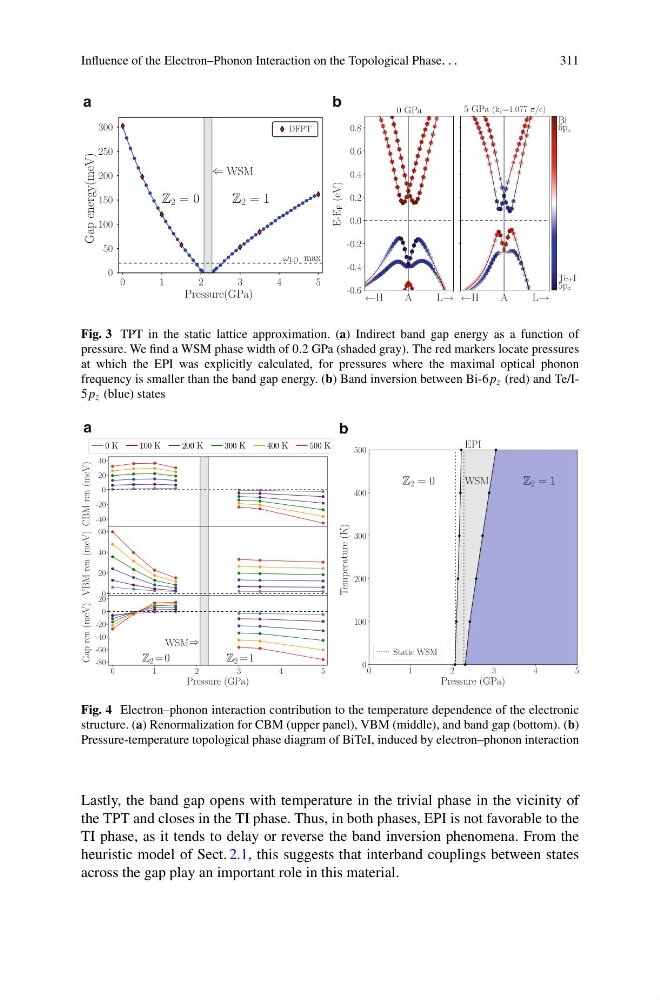
Fig. 3 TPT in the static lattice approximation. (a) Indirect band gap energy as a function of
pressure. We find a WSM phase width of 0.2 GPa (shaded gray). The red markers locate pressures
at which the EPI was explicitly calculated, for pressures where the maximal optical phonon
frequency is smaller than the band gap energy. (b) Band inversion between Bi-6p z (red) and Te/I5p z (blue) states
-40
-20
0
20
40
CBM ren (meV)
0 K
100 K
200 K
300 K
400 K
500 K
0 K
100 K
200 K
300 K
400 K
500 K
0
20
40
60
VBM ren (meV)
0
1
2
3
4
5
Pressure (GPa)
-80
-60
-40
-20
0
20
Gap ren (meV)
Z 2 =0
Z 2 =1
⇒
WSM
0
1
2
3
4
5
Pressure (GPa)
0
100
200
300
400
500
Temperature (K)
Z 2 = 0
Z 2 = 1
WSM
EPI
Static WSM
a
b
Fig. 4 Electron–phonon interaction contribution to the temperature dependence of the electronic
structure. (a) Renormalization for CBM (upper panel), VBM (middle), and band gap (bottom). (b)
Pressure-temperature topological phase diagram of BiTeI, induced by electron–phonon interaction
Lastly, the band gap opens with temperature in the trivial phase in the vicinity of
the TPT and closes in the TI phase. Thus, in both phases, EPI is not favorable to the
TI phase, as it tends to delay or reverse the band inversion phenomena. From the
heuristic model of Sect. 2.1, this suggests that interband couplings between states
across the gap play an important role in this material.
311
Pressure(GPa)
0
0
1
2
3
4
5
50
100
150
200
250
300
a
b
Gap energy(meV)
Z 2 = 0
Z 2 = 1
⇐ WSM
ωLO max
DFPT
←H
A
L→
-0.6
-0.4
-0.2
0.0
0.2
0.4
0.6
0.8
E-E
F (eV)
0 GPa
←H
A
L→
5 GPa (kz=1.077 π/c)
5pz
Te+I
6pz
Bi
Fig. 3 TPT in the static lattice approximation. (a) Indirect band gap energy as a function of
pressure. We find a WSM phase width of 0.2 GPa (shaded gray). The red markers locate pressures
at which the EPI was explicitly calculated, for pressures where the maximal optical phonon
frequency is smaller than the band gap energy. (b) Band inversion between Bi-6p z (red) and Te/I5p z (blue) states
-40
-20
0
20
40
CBM ren (meV)
0 K
100 K
200 K
300 K
400 K
500 K
0 K
100 K
200 K
300 K
400 K
500 K
0
20
40
60
VBM ren (meV)
0
1
2
3
4
5
Pressure (GPa)
-80
-60
-40
-20
0
20
Gap ren (meV)
Z 2 =0
Z 2 =1
⇒
WSM
0
1
2
3
4
5
Pressure (GPa)
0
100
200
300
400
500
Temperature (K)
Z 2 = 0
Z 2 = 1
WSM
EPI
Static WSM
a
b
Fig. 4 Electron–phonon interaction contribution to the temperature dependence of the electronic
structure. (a) Renormalization for CBM (upper panel), VBM (middle), and band gap (bottom). (b)
Pressure-temperature topological phase diagram of BiTeI, induced by electron–phonon interaction
Lastly, the band gap opens with temperature in the trivial phase in the vicinity of
the TPT and closes in the TI phase. Thus, in both phases, EPI is not favorable to the
TI phase, as it tends to delay or reverse the band inversion phenomena. From the
heuristic model of Sect. 2.1, this suggests that interband couplings between states
across the gap play an important role in this material.