

40
namely cassava (Manihot esculentum) and maize (Zea mays), which are respectively
the first and second most important staple crops by area of cultivation and total
production. Using a model-based approach, this study assessed the impacts of climate change on the spatial extent of areas classified as climatically suitable for
maize and cassava, between the “historical baseline” period (i.e., the present) and a
future date (2050). The goal of these analyses is to improve decision-making and
spatial planning regarding which crops, cultivars and farming practices should be
promoted as part of a strategy for climate-resilient agricultural and socio-economic
development in the planalto.
4.2 Materials and Methods
4.2.1 Sources of Climate Data
Baseline climate data for the study area was derived from Worldclim historical data,
which provides average monthly climate data for minimum, mean and maximum
temperature and for precipitation for the period 1960–1990 at a spatial resolution of
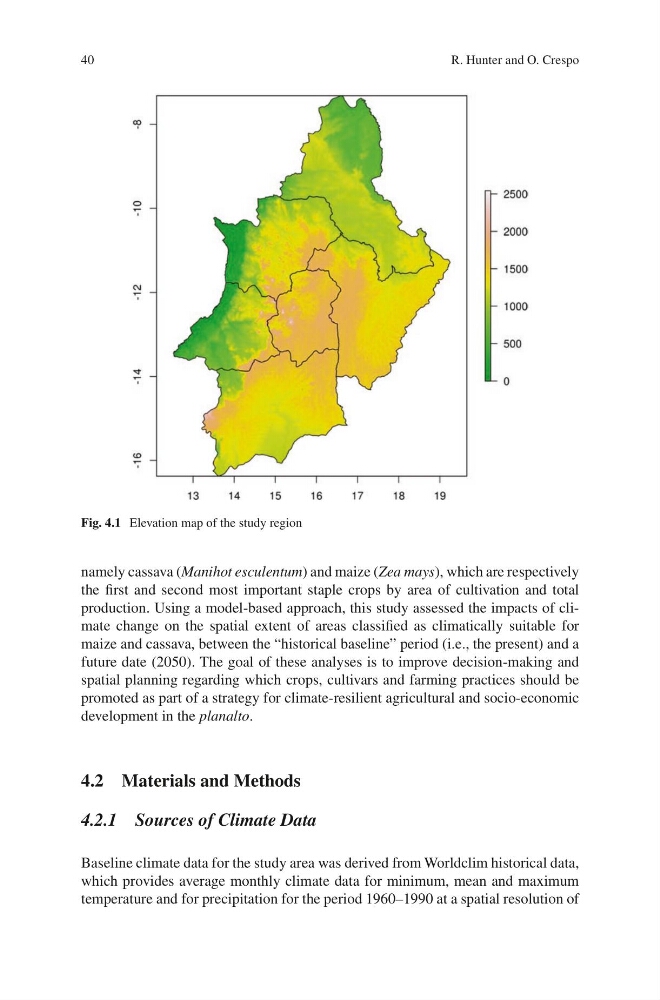
Fig. 4.1 Elevation map of the study region
R. Hunter and O. Crespo
namely cassava (Manihot esculentum) and maize (Zea mays), which are respectively
the first and second most important staple crops by area of cultivation and total
production. Using a model-based approach, this study assessed the impacts of climate change on the spatial extent of areas classified as climatically suitable for
maize and cassava, between the “historical baseline” period (i.e., the present) and a
future date (2050). The goal of these analyses is to improve decision-making and
spatial planning regarding which crops, cultivars and farming practices should be
promoted as part of a strategy for climate-resilient agricultural and socio-economic
development in the planalto.
4.2 Materials and Methods
4.2.1 Sources of Climate Data
Baseline climate data for the study area was derived from Worldclim historical data,
which provides average monthly climate data for minimum, mean and maximum
temperature and for precipitation for the period 1960–1990 at a spatial resolution of
Fig. 4.1 Elevation map of the study region
R. Hunter and O. Crespo