

133
climate happen with different probabilities. In our example, we have determined
with long-term weather data or seasonal climate forecasting that the probability of
dry conditions during the growing season is 0.6 and of a wet condition 0.4.
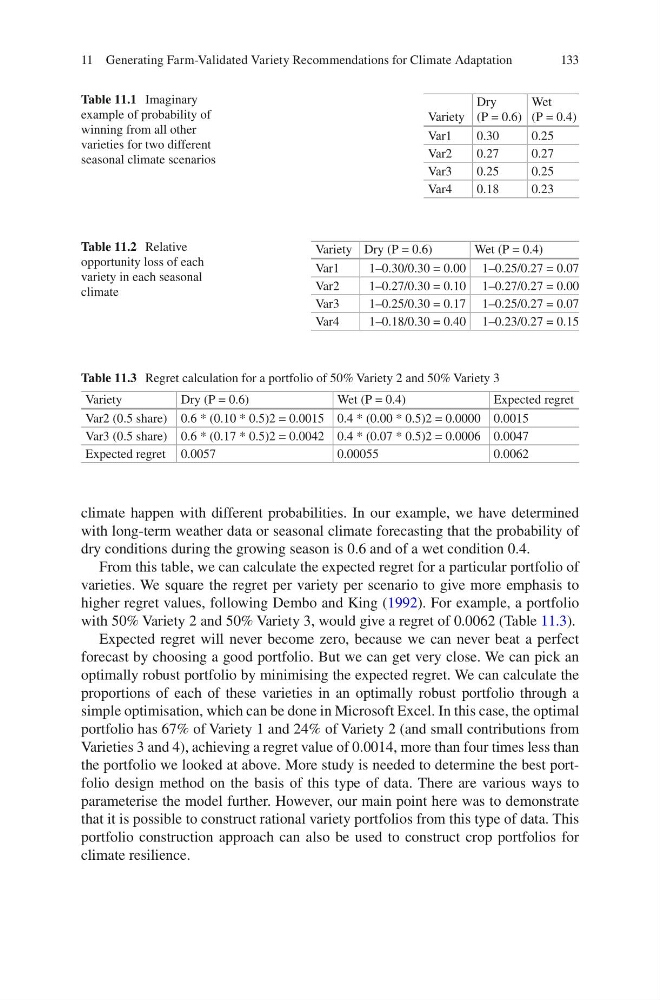
From this table, we can calculate the expected regret for a particular portfolio of
varieties. We square the regret per variety per scenario to give more emphasis to
higher regret values, following Dembo and King (1992). For example, a portfolio
with 50% Variety 2 and 50% Variety 3, would give a regret of 0.0062 (Table 11.3).
Expected regret will never become zero, because we can never beat a perfect
forecast by choosing a good portfolio. But we can get very close. We can pick an
optimally robust portfolio by minimising the expected regret. We can calculate the
proportions of each of these varieties in an optimally robust portfolio through a
simple optimisation, which can be done in Microsoft Excel. In this case, the optimal
portfolio has 67% of Variety 1 and 24% of Variety 2 (and small contributions from
Varieties 3 and 4), achieving a regret value of 0.0014, more than four times less than
the portfolio we looked at above. More study is needed to determine the best portfolio design method on the basis of this type of data. There are various ways to
parameterise the model further. However, our main point here was to demonstrate
that it is possible to construct rational variety portfolios from this type of data. This
portfolio construction approach can also be used to construct crop portfolios for
climate resilience.
Table 11.1 Imaginary
example of probability of
winning from all other
varieties for two different
seasonal climate scenarios
Variety
Dry
(P = 0.6)
Wet
(P = 0.4)
Var1
0.30
0.25
Var2
0.27
0.27
Var3
0.25
0.25
Var4
0.18
0.23
Table 11.2 Relative
opportunity loss of each
variety in each seasonal
climate
Variety Dry (P = 0.6)
Wet (P = 0.4)
Var1
1–0.30/0.30 = 0.00 1–0.25/0.27 = 0.07
Var2
1–0.27/0.30 = 0.10 1–0.27/0.27 = 0.00
Var3
1–0.25/0.30 = 0.17 1–0.25/0.27 = 0.07
Var4
1–0.18/0.30 = 0.40 1–0.23/0.27 = 0.15
Table 11.3 Regret calculation for a portfolio of 50% Variety 2 and 50% Variety 3
Variety
Dry (P = 0.6)
Wet (P = 0.4)
Expected regret
Var2 (0.5 share) 0.6 * (0.10 * 0.5)2 = 0.0015 0.4 * (0.00 * 0.5)2 = 0.0000 0.0015
Var3 (0.5 share) 0.6 * (0.17 * 0.5)2 = 0.0042 0.4 * (0.07 * 0.5)2 = 0.0006 0.0047
Expected regret 0.0057
0.00055
0.0062
11 Generating Farm-Validated Variety Recommendations for Climate Adaptation
climate happen with different probabilities. In our example, we have determined
with long-term weather data or seasonal climate forecasting that the probability of
dry conditions during the growing season is 0.6 and of a wet condition 0.4.
From this table, we can calculate the expected regret for a particular portfolio of
varieties. We square the regret per variety per scenario to give more emphasis to
higher regret values, following Dembo and King (1992). For example, a portfolio
with 50% Variety 2 and 50% Variety 3, would give a regret of 0.0062 (Table 11.3).
Expected regret will never become zero, because we can never beat a perfect
forecast by choosing a good portfolio. But we can get very close. We can pick an
optimally robust portfolio by minimising the expected regret. We can calculate the
proportions of each of these varieties in an optimally robust portfolio through a
simple optimisation, which can be done in Microsoft Excel. In this case, the optimal
portfolio has 67% of Variety 1 and 24% of Variety 2 (and small contributions from
Varieties 3 and 4), achieving a regret value of 0.0014, more than four times less than
the portfolio we looked at above. More study is needed to determine the best portfolio design method on the basis of this type of data. There are various ways to
parameterise the model further. However, our main point here was to demonstrate
that it is possible to construct rational variety portfolios from this type of data. This
portfolio construction approach can also be used to construct crop portfolios for
climate resilience.
Table 11.1 Imaginary
example of probability of
winning from all other
varieties for two different
seasonal climate scenarios
Variety
Dry
(P = 0.6)
Wet
(P = 0.4)
Var1
0.30
0.25
Var2
0.27
0.27
Var3
0.25
0.25
Var4
0.18
0.23
Table 11.2 Relative
opportunity loss of each
variety in each seasonal
climate
Variety Dry (P = 0.6)
Wet (P = 0.4)
Var1
1–0.30/0.30 = 0.00 1–0.25/0.27 = 0.07
Var2
1–0.27/0.30 = 0.10 1–0.27/0.27 = 0.00
Var3
1–0.25/0.30 = 0.17 1–0.25/0.27 = 0.07
Var4
1–0.18/0.30 = 0.40 1–0.23/0.27 = 0.15
Table 11.3 Regret calculation for a portfolio of 50% Variety 2 and 50% Variety 3
Variety
Dry (P = 0.6)
Wet (P = 0.4)
Expected regret
Var2 (0.5 share) 0.6 * (0.10 * 0.5)2 = 0.0015 0.4 * (0.00 * 0.5)2 = 0.0000 0.0015
Var3 (0.5 share) 0.6 * (0.17 * 0.5)2 = 0.0042 0.4 * (0.07 * 0.5)2 = 0.0006 0.0047
Expected regret 0.0057
0.00055
0.0062
11 Generating Farm-Validated Variety Recommendations for Climate Adaptation