

78
P. Panwaria and A. Das
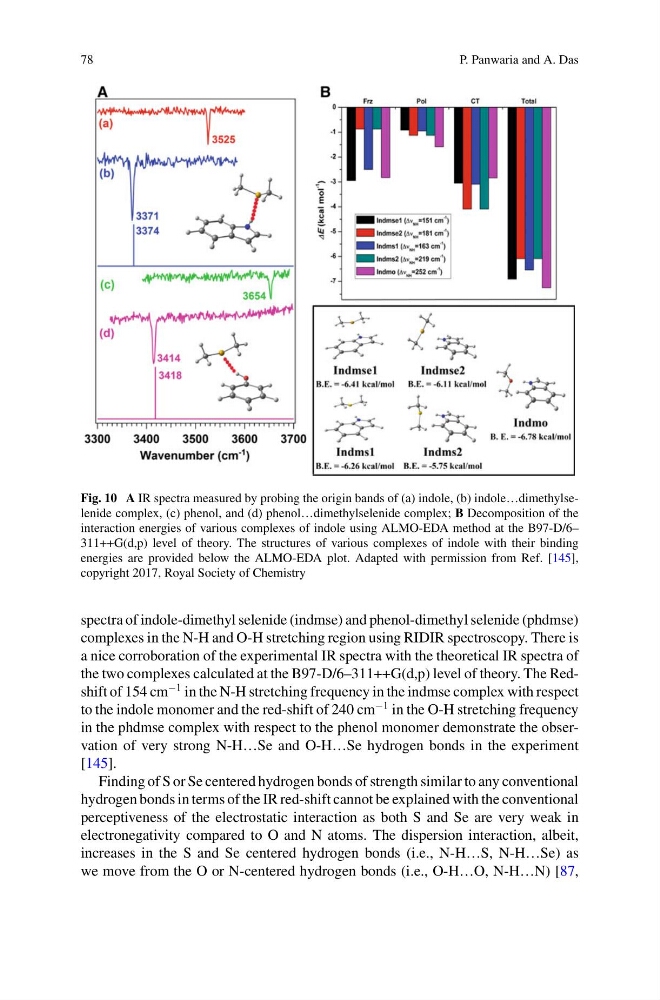
Fig. 10 A IR spectra measured by probing the origin bands of (a) indole, (b) indole…dimethylselenide complex, (c) phenol, and (d) phenol…dimethylselenide complex; B Decomposition of the
interaction energies of various complexes of indole using ALMO-EDA method at the B97-D/6–
311++G(d,p) level of theory. The structures of various complexes of indole with their binding
energies are provided below the ALMO-EDA plot. Adapted with permission from Ref. [145],
copyright 2017, Royal Society of Chemistry
spectra of indole-dimethyl selenide (indmse) and phenol-dimethyl selenide (phdmse)
complexes in the N-H and O-H stretching region using RIDIR spectroscopy. There is
a nice corroboration of the experimental IR spectra with the theoretical IR spectra of
the two complexes calculated at the B97-D/6–311++G(d,p) level of theory. The Redshift of 154 cm
−1 in the N-H stretching frequency in the indmse complex with respect
to the indole monomer and the red-shift of 240 cm
−1 in the O-H stretching frequency
in the phdmse complex with respect to the phenol monomer demonstrate the observation of very strong N-H…Se and O-H…Se hydrogen bonds in the experiment
[145].
Finding of S or Se centered hydrogen bonds of strength similar to any conventional
hydrogen bonds in terms of the IR red-shift cannot be explained with the conventional
perceptiveness of the electrostatic interaction as both S and Se are very weak in
electronegativity compared to O and N atoms. The dispersion interaction, albeit,
increases in the S and Se centered hydrogen bonds (i.e., N-H…S, N-H…Se) as
we move from the O or N-centered hydrogen bonds (i.e., O-H…O, N-H…N) [87,
P. Panwaria and A. Das
Fig. 10 A IR spectra measured by probing the origin bands of (a) indole, (b) indole…dimethylselenide complex, (c) phenol, and (d) phenol…dimethylselenide complex; B Decomposition of the
interaction energies of various complexes of indole using ALMO-EDA method at the B97-D/6–
311++G(d,p) level of theory. The structures of various complexes of indole with their binding
energies are provided below the ALMO-EDA plot. Adapted with permission from Ref. [145],
copyright 2017, Royal Society of Chemistry
spectra of indole-dimethyl selenide (indmse) and phenol-dimethyl selenide (phdmse)
complexes in the N-H and O-H stretching region using RIDIR spectroscopy. There is
a nice corroboration of the experimental IR spectra with the theoretical IR spectra of
the two complexes calculated at the B97-D/6–311++G(d,p) level of theory. The Redshift of 154 cm
−1 in the N-H stretching frequency in the indmse complex with respect
to the indole monomer and the red-shift of 240 cm
−1 in the O-H stretching frequency
in the phdmse complex with respect to the phenol monomer demonstrate the observation of very strong N-H…Se and O-H…Se hydrogen bonds in the experiment
[145].
Finding of S or Se centered hydrogen bonds of strength similar to any conventional
hydrogen bonds in terms of the IR red-shift cannot be explained with the conventional
perceptiveness of the electrostatic interaction as both S and Se are very weak in
electronegativity compared to O and N atoms. The dispersion interaction, albeit,
increases in the S and Se centered hydrogen bonds (i.e., N-H…S, N-H…Se) as
we move from the O or N-centered hydrogen bonds (i.e., O-H…O, N-H…N) [87,